Department of Biochemistry and Molecular Biology, Seoul National University College of Medicine, 103 Daehak-ro, Jongno-gu, Seoul 03080, Republic of Korea.
Department of Internal Medicine, Seoul National University College of Medicine, Seoul 03080, Republic of Korea.
Center for Thyroid Cancer, National Cancer Center, Goyang 10408, Republic of Korea.
Department of Biomedical Sciences, Seoul National University Graduate School, Seoul 03080, Republic of Korea.
Genomic Medicine Institute, Medical Research Center, Seoul National University, Seoul 03080, Republic of Korea.
Graduate Program in Genetic Counseling, Northwestern University, Chicago, Illinois 60637, USA.
Molecular Epidemiology Branch, Division of Cancer Epidemiology and Prevention, Research Institute, National Cancer Center, Goyang 10408, Republic of Korea.
Department of Surgery, Seoul National University College of Medicine, Seoul 03080, Republic of Korea.
Department of Preventive Medicine Ajou University School of Medicine, Suwon 16499, Republic of Korea.
Department of Epidemiology and Institute of Environment and Health, School of Public Health, Seoul National University, Seoul 08826, Republic of Korea.
Cancer Research Institute, Seoul National University College of Medicine, Seoul 03080, Republic of Korea.
Abstract
Thyroid cancer is the most common cancer in Korea. Several susceptibility loci of differentiated thyroid cancer (DTC) were identified by previous genome-wide association studies (GWASs) in Europeans only. Here we conducted a GWAS and a replication study in Koreans using a total of 1,085 DTC cases and 8,884 controls, and validated these results using expression quantitative trait loci (eQTL) analysis and clinical phenotypes. The most robust associations were observed in the NRG1 gene (rs6996585, P=1.08 × 10⁻¹⁰) and this SNP was also associated with NRG1 expression in thyroid tissues. In addition, we confirmed three previously reported loci (FOXE1, NKX2-1 and DIRC3) and identified seven novel susceptibility loci (VAV3, PCNXL2, INSR, MRSB3, FHIT, SEPT11 and SLC24A6) associated with DTC. Furthermore, we identified specific variants of DTC that have different effects according to cancer type or ethnicity. Our findings provide deeper insight into the genetic contribution to thyroid cancer in different populations.
Figures
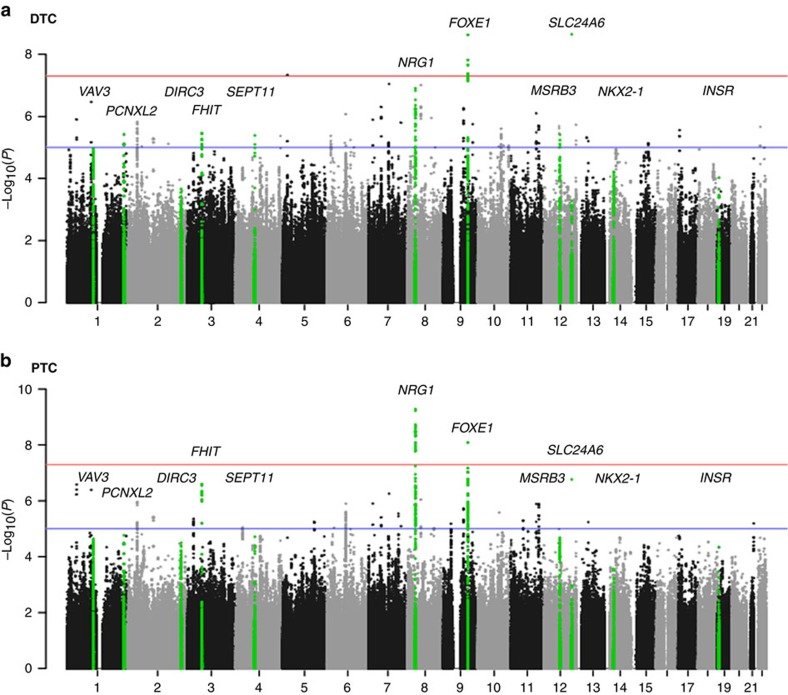
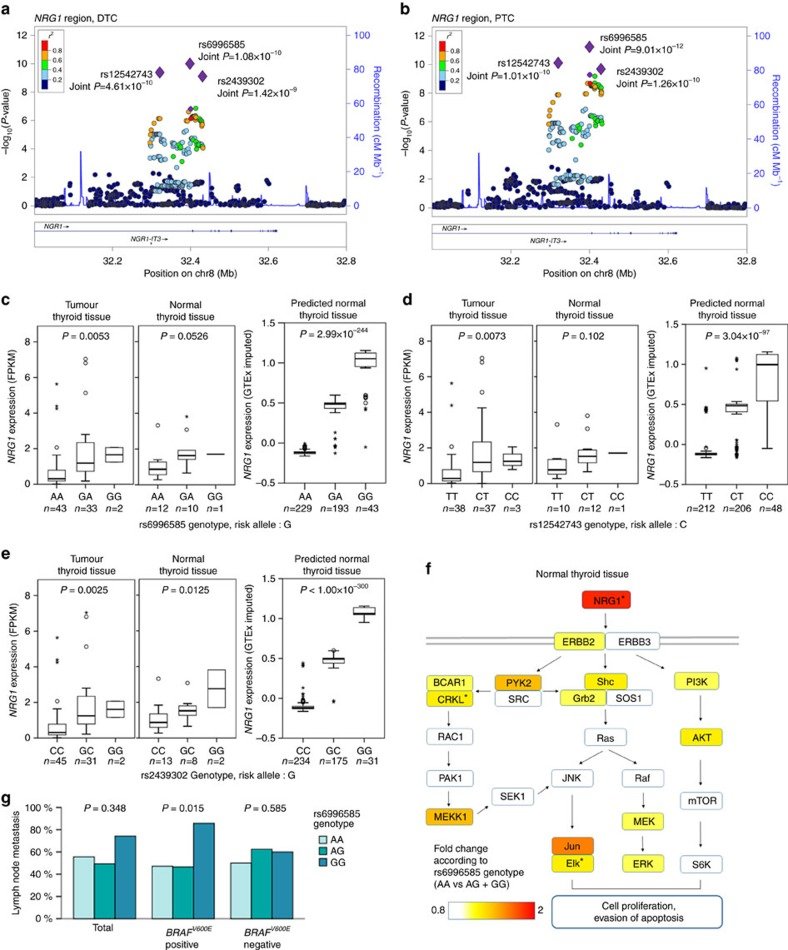
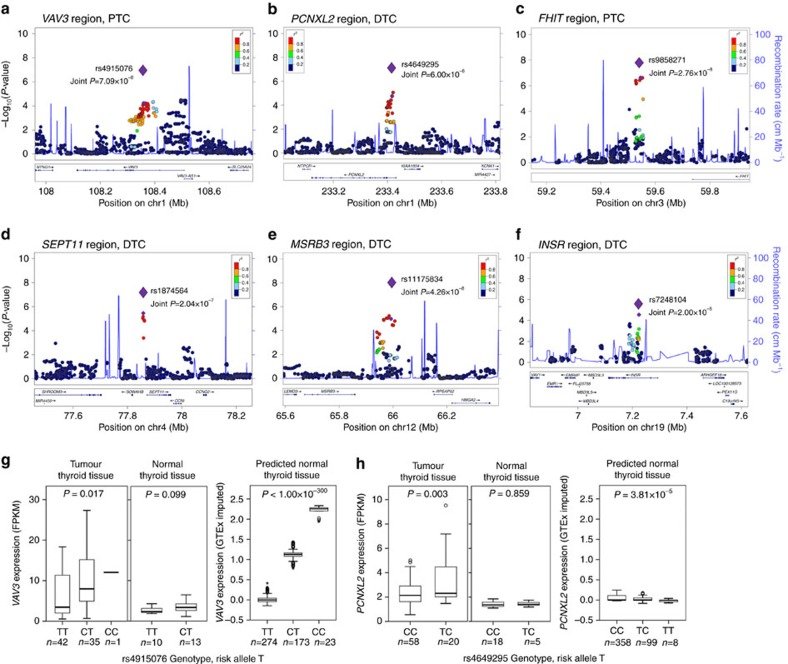
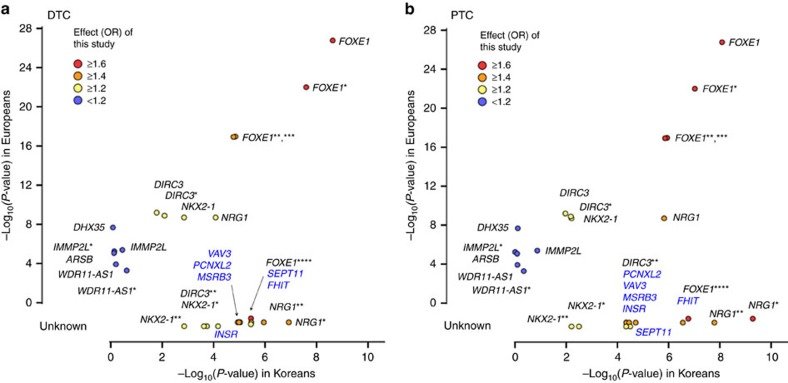
Figure 1 Genome-wide association plot for thyroid cancer. The Manhattan plots of genome-wide association signals with (a) DTC and (b) PTC for stage 1. The x-axis represents the SNP markers on each chromosome. The y-axis shows the −log10P-value (logistic regression). The red horizontal line represents the genome-wide significance threshold P=5.0 × 10⁻⁸, and the blue horizontal line represents the genome-wide suggestiveness threshold P=1.0 × 10⁻⁶. Eleven candidate loci of DTC, PTC or FTC are shown in green.Figure 2 Regional association plots and expression of the most associated variant in NRG1 locus. Regional association plots for (a) DTC and (b) PTC. The large purple diamonds indicate the associated SNPs according to joint analyses. Nearby SNPs are colour coded according to the level of LD with the top SNP. The left y-axis shows the significance of the association on a −log10P-value (logistic regression), and the right y-axis shows the recombination rate across the region. Estimated recombination rates from the 1000 Genomes ASN, hg19 database are plotted by the blue line to reflect the local LD structure. The cis-eQTL result of NRG1 in tumour and normal thyroid tissues and the predicted expression of 470 DTC cases according to the (c) rs6996585, (d) rs12542743 and (e) rs2439302 genotypes (additive model of linear regression analyses, error bars represent s.e.m.). (f) The characteristic gene expression of normal thyroid tissue. The genes in the ERBB-MAPK signalling pathway are represented by the fold change according to the rs6996585 genotype (AA vs AG+GG). Asterisks indicate a significant fold change with a P-value <0.05 (t-test). (g) Lymph node metastasis according to the rs6996585 genotypes and the BRAF mutation (additive model of linear regression analyses).Figure 3 Regional association plots and expression of the novel DTC-associated variant. A regional association plot for the (a) VAV3, (b) PCNXL2, (c) FHIT, (d) SEPT11, (e) MSRB3 and (f) INSR regions. The large purple diamonds indicate the most associated SNPs according to joint analyses and nearby SNPs are colour coded according to the level of LD with the top SNP. The left y-axis shows the significance of the association on a −log10P-value (logistic regression), and the right y-axis shows the recombination rate across the region. Estimated recombination rates from the 1,000 Genomes ASN, hg19 database are plotted by the blue line to reflect the local LD structure. The cis-eQTL results of (g) VAV3 and (h) PCNXL2 in tumour and normal thyroid tissues, and the predicted expression of 470 DTC cases according to the rs4915076 and rs4649295 genotypes, respectively (additive model of linear regression analyses, error bars represent s.e.m.).Figure 4 Comparison of association result between Europeans and Koreans. The P-values for (a) DTC and (b) PTC between Koreans (x-axis) and Europeans (y-axis) are plotted with the corresponding Korean effect sizes (OR; Odd Ratio). The P-value shows the −log10 scale, and the P-values of novel SNPs from this study are compared as unknown. The novel genes of this study are shown in blue. SNPs of the same gene are distinguished by FOXE1 for rs965513, FOXE1* for rs7028661, FOXE1*** for rs10122541, FOXE1**** for rs72753537, DIRC3 for rs966423, DIRC3* for rs6759952, NRG1 for rs2439302, NRG1* for rs6996585, NRG1** for rs12542743, NKX2-1 for rs944289, NKX2-1* for rs34081947, NKX2-1** for rs944289, DIRC3 for rs6759952, DIRC3* for rs966423, DIRC3** for rs12990503, IMMP2L for rs10238549, IMMP2L* for rs7800391, WDR11-AS1 for rs2997312 and WDR11-AS1* for rs10788123.
그림 출처: PubMed Central 공개 논문 (PMC5511346)
Conflict of interest statement
The authors declare no competing financial interests.