Reduced cohesin destabilizes high-level gene amplification by disrupting pre-replication complex bindings in human cancers with chromosomal instability.
Cancer Research Institute, Seoul National University, Seoul 110-799, Republic of Korea Department of Molecular Medicine and Biopharmaceutical Sciences, Graduate School of Convergence Science and Technology, Seoul National University, Seoul 110-799, Republic of Korea.
Cancer Research Institute, Seoul National University, Seoul 110-799, Republic of Korea.
Cancer Research Institute, Seoul National University, Seoul 110-799, Republic of Korea Department of Internal Medicine, Seoul National University Hospital, Seoul 110-744, Republic of Korea.
Cancer Research Institute, Seoul National University, Seoul 110-799, Republic of Korea Department of Molecular Medicine and Biopharmaceutical Sciences, Graduate School of Convergence Science and Technology, Seoul National University, Seoul 110-799, Republic of Korea Department of Internal Medicine, Seoul National University Hospital, Seoul 110-744, Republic of Korea kimty@snu.ac.kr.
Abstract
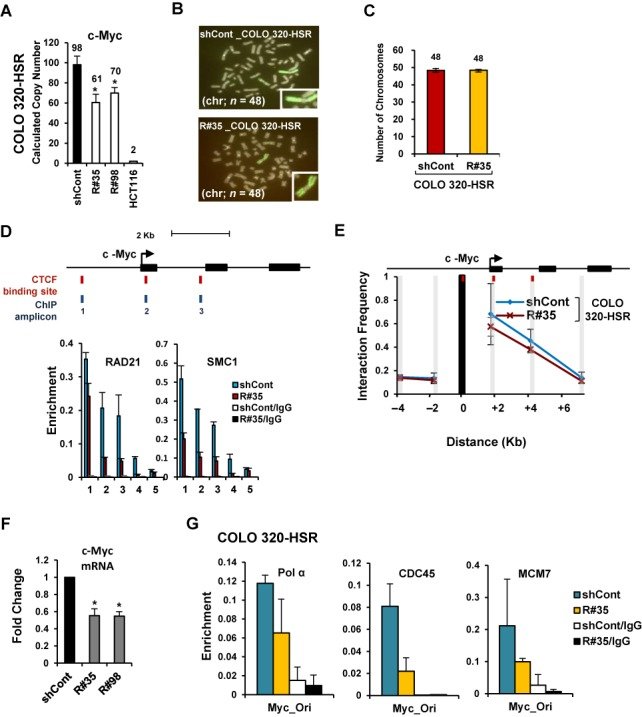
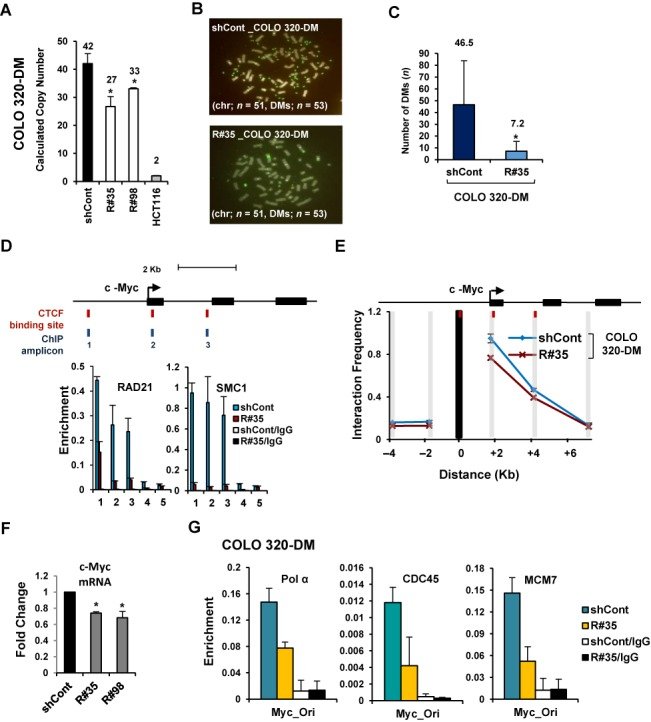
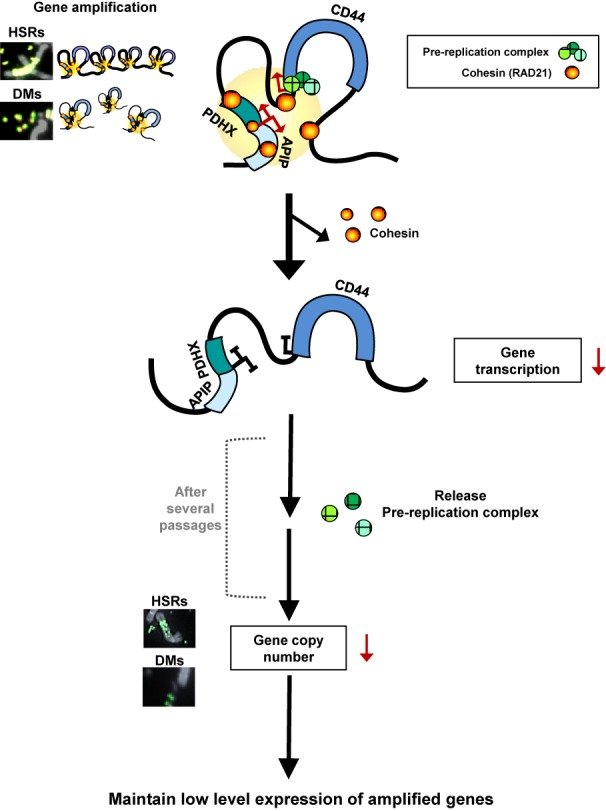
Gene amplification is a hallmark of cancer with chromosomal instability although the underlying mechanism by which altered copy numbers are maintained is largely unclear. Cohesin, involved in sister chromatid cohesion, DNA repair, cell cycle progression and transcriptional regulation of key developmental genes, is frequently overexpressed in human cancer. Here we show that cohesin-dependent change in DNA replication controls the copy numbers of amplified genes in cancer cells with chromosomal instability. We found that the down-regulation of elevated cohesin leads to copy number-associated gene expression changes without disturbing chromosomal segregation. Highly amplified genes form typical long-range chromatin interactions, which are stabilized by enriched cohesin. The spatial proximities among cohesin binding sites within amplified genes are decreased by RAD21-knockdown, resulting in the rapid decline of amplified gene expression. After several passages, cohesin depletion inhibits DNA replication initiation by reducing the recruitment of pre-replication complexes such as minichromosome maintenance subunits 7 (MCM7), DNA polymerase α, and CDC45 at replication origins near the amplified regions, and as a result, decreases the DNA copy numbers of highly amplified genes. Collectively, our data demonstrate that cohesin-mediated chromatin organization and DNA replication are important for stabilizing gene amplification in cancer cells with chromosomal instability.
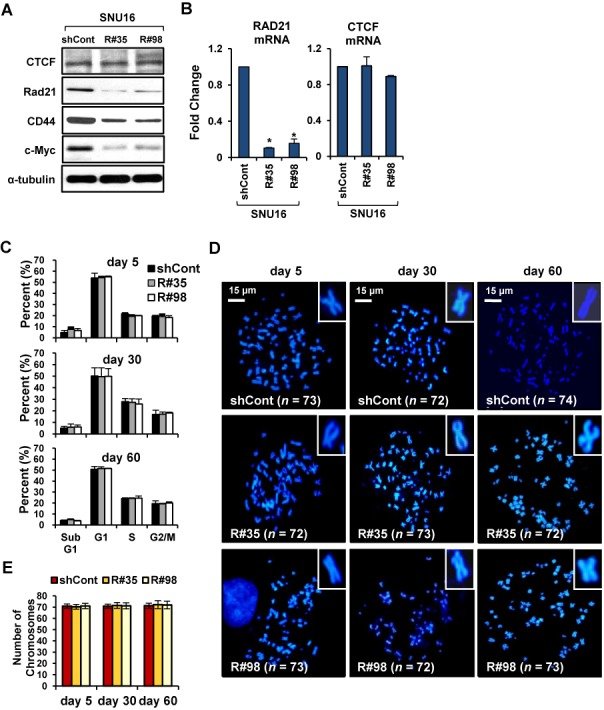
Figure 1.Stable down-regulation of cohesin does not led to mitotic arrest or the development of chromosomal segregation defect in SNU16 cells. (A, B) SNU16 cells were stably transduced with control GFP-shRNA or two different RAD21-shRNAs (R#35 and R#98). (A) Western blot analysis was performed with the indicated antibodies on day 60 after RAD21-KD in SNU16 cells. α-tubulin served as a loading control. (B) RAD21 or CTCF mRNA expression was analyzed by qRT-PCR on day 60 after RAD21-KD in SNU16 cells. Each value was normalized to that of 18S ribosomal RNA relative to the control GFP-shRNA expressing SNU16 cells. Error bars represent the SD, n = 3 biological replicates from independent viral transduction. *P < 0.01; Student's t test. (C) SNU16 cells were stained with propidium iodide at the day 5, 30 and 60 after RAD21-KD, and then subjected to FACS analysis. The percentage of cells in the Sub G1, G1, S and G2/M phases are shown. (Mean ± SD, n = 3 biological replicates). (D) A metaphase chromosome spread was prepared by treatment with nocodazol, a microtubule polymerization inhibitor (16), at the day 5, 30 and 60 after RAD21-KD in SNU16 cells and then cells were stained with DAPI. Scale bar = 15 μm. (E) The total chromosome numbers of the control GFP-KD or RAD21-KD SNU16 cells populations were counted at the day 5, 30 and 60 after three independent viral transduction procedures. Fifty mitotic spreads were evaluated for each sample (± SD). Representative FISH images are shown in (D).Figure 2.Reduction of cohesin leads to transcriptional inefficiency of the APIP/PDHX/CD44 locus in SNU16 cells. (A) The APIP/PDHX/CD44 locus at chromosome 11p13 is illustrated to scale. The location of putative CTCF/cohesin binding sites and the primer pairs used for qPCR are shown with names below. (B) APIP and CD44 expression was measured by qRT-PCR on day 60 after RAD21-KD in SNU16 cells. Each value was normalized to that of 18S ribosomal RNA relative to the control GFP-KD cells. (Mean ± SD, n = 3 biological replicates. *P < 0.01; **P < 0.05). (C–E) A ChIP assay was carried out with the control GFP-KD (blue bar) or RAD21-KD SNU16 cells (R#35; red bar) on day 60 after lentivial transduction using antibodies against to (C) CTCF, (D) RAD21, and (E) SMC1. The enrichment of target DNA over the input was calculated using the ΔΔCt method (17). 3′HS1 (amplicon 12) of the human β-globin locus and Necdin (amplicon 13) served as positive and negative controls, respectively, for CTCF/RAD21 binding (17). (Mean ± SEM, n = 3 biological replicates). (F, G) Relative crosslinking frequencies among CTCF/RAD21 binding sites within the APIP/PDHX/CD44 locus were measured with a 3C assay in the control GFP-KD (blue line) or RAD21-KD SNU16 cells (red line) on day 60 after lentivial transduction. The EcoRI restriction fragments in the APIP/PDHX/CD44 locus appear as gray shaded bars. Black shading indicates the anchor fragment of (F) the 3′ end of CD44 and (G) the 3′ end of PDHX. Each value was normalized to the crosslinking frequency at the CalR gene and the total DNA copy numbers to determine the correct signal per region (41). The maximum crosslinking frequency was set to 1. (Mean ± SEM, n = 3 biological replicates).Figure 3.Copy-numbers of amplified APIP/PDHX/CD44 locus are decreased by cohesin reduction in SNU16 cells. (A) High-resolution array-CGH analysis was performed with the control GFP-KD or RAD21-KD SNU16 cells on day 60 after RAD21-KD. Chromosome 11 is represented by ideograms showing G-banding patterns (left ideogram, RAD21-KD SNU16 cells compared with the control GFP-KD cells; right ideogram, parental SNU16 cells compared with normal gastric cells). Gains/amplifications (red) are shown on the right side of each ideogram, while losses (blue) appear on the left side. APIP/PDHX/CD44 locus for further analyses are indicated by yellow boxes. (B) Localization of the FISH probes specific for APIP/PDHX (labeled with Cy3, red), and CD44 (labeled with FITC, green) located on chromosome 11p13 is depicted. Metaphase FISH analysis of the APIP/PDHX/CD44 locus on chromosome 11p13 in SNU16 cells revealed that two different probes co-localized on the same locus and exist in three types of amplification: DMs (), HSRs () and distributed insertions (). (C) Cohesin-mediated focal copy-number changes of APIP and CD44 were evaluated using a TaqMan-quantitative PCR-based CNV assay with control GFP-KD or RAD21-KD SNU16 cells on day 60 after viral transduction. Data are presented as averages ± SD of biological triplicate independent viral transduction experiments. *P < 0.01. (D) A metaphase FISH analysis was performed to assess CD44 on HSR or DMs in the control GFP-KD (shCont) and RAD21-KD SNU16 cells (R#35) on day 60 after lentivial transduction. Chromosome-2 centromere (labeled with Cy3 for the control; white arrows) served as control. A schematic representation of the localization of the FISH probes specific for CD44 (labeled with FITC; green) located at chromosome 11p13 is shown above. (E) The total numbers per cell of DMs containing CD44 were blindly counted in the control GFP-KD and RAD21-KD SNU16 cells on day 60 after lentivial transduction. Fifty mitotic spreads were evaluated per sample (± SD). Representative FISH images are shown in (D). *P < 0.01.Figure 4.Down-regulation of cohesin impairs localization of pre-replication complex at replication origins within the amplified APIP/PDHX/CD44 locus. (A) A ChIP assay was performed with SNU16 (blue bar) and HCT116 (red bar) cells using antibodies against RAD21, DNA polymerase α (Pol α), MCM7 and CDC45. The location of previously published replication origin sequences (70) near the APIP/PDHX/CD44 locus used for qPCR are shown with names below. (Mean ± SEM, n = 3 biological replicates). (B) A ChIP assay was performed with control GFP-KD (blue bar) or RAD21-KD SNU16 cells (R#35; yellow bar) on day 60 after lentivial transduction using antibodies against RAD21, Pol α, MCM7 and CDC45. (Mean ± SEM, n = 3 biological replicates). (C) Immunofluorescence staining of DNA (DAPI, blue), MCM7 (green) and RAD21 (red) in control GFP- KD (left panel) or RAD21-KD SNU16 cells (right panel). (D) Percentage of MCM7 and RAD21 co-localization in control GFP-KD (filled bar) or RAD21-KD SNU16 cells (unfilled bar) by unbiased automatic quantification (39). Data are presented as averages ± SD of individual cells (n = 100). *P < 0.01; Student's t test.Figure 5.Copy-numbers of amplified gene existing in HSRs are decreased by cohesin reduction. (A) COLO 320-HSR cells were stably transduced with control GFP-shRNA or two different Rad21-shRNAs (R#35 and R#98). Changes in copy-numbers of the c-Myc were quantified using a TaqMan quantitative PCR-based CNV assay. The average of three viral transduction experiments ± SD is presented. *P < 0.01. (B) Metaphase FISH analysis with c-Myc (labeled with FITC; green) and chromosome 2 centromere (labeled with Cy3 for the control; red) revealed a reduction of c-Myc located within HSR in RAD21-KD COLO 320-HSR cells. Notably, amplified c-Myc exists as HSR and inverted repeats within the chromosome of the COLO 320-HSR cells. (C) Total chromosome numbers of the control GFP-KD or RAD21-KD COLO 320-HSR cells were counted after treatment with nocodazol. Fifty mitotic spreads were evaluated for each sample (± SD). (D) A ChIP was performed with antibodies to Rad21 and SMC1 in control GFP-KD (blue bar) or RAD21-KD COLO 320-HSR (red bar). (Mean ± SEM, n = 3). c-Myc at chromosome 8q24 are illustrated to scale. The location of putative CTCF/Rad21 binding sites and primer pairs used for qPCR are shown with names below. 3′HS1 of the human β-globin locus (amplicon 4) and Necdin (amplicon 5) served as controls. (E) 3C assay of c-Myc in COLO 320-HSR cells after RAD21-KD. DpnII restriction sites in c-Myc appear as gray shaded bars. Black shading indicates the anchor fragment of the 5′ CTCF binding sites of c-Myc. (Mean ± SEM, n = 3 biological replicates). (F) The expression of c-Myc was measured by qRT-PCR on day 60 after RAD21-KD in COLO 320-HSR cells. Each value was normalized to that of 18S ribosomal RNA relative to the control GFP-KD cells. The average of biological triplicate independent viral transduction experiments ± SD is presented. *P < 0.01. (G) A ChIP assay using previously published replication origin sequences near the c-Myc locus (70) was performed with antibodies against Pol α, CDC45 and MCM7 in control GFP-KD or RAD21-KD COLO 320-HSR cells on day 60 after lentivial transduction. (Mean ± SEM, n = 3 biological replicates).Figure 6.Copy-numbers of amplified gene existing in DMs are decreased by cohesin reduction. (A) COLO 320-DM cells were stably transduced with control GFP-shRNA or two different Rad21-shRNAs (R#35 and R#98). Changes in copy-numbers of the c-Myc were quantified using a TaqMan quantitative PCR-based CNV assay. The average of three viral transduction experiments ± SD is presented. *P < 0.01. (B) Metaphase FISH analysis with c-Myc (labeled with FITC; green) and chromosome 2 centromere (labeled with Cy3 for the control; red) revealed a reduction of c-Myc located within DMs in RAD21-KD COLO 320-DM cells. (C) Total numbers of DMs per cell were blindly counted in control GFP-KD and RAD21-KD COLO 320-DM cells. (Mean ± SD, n = 50). *P < 0.01. (D) A ChIP was performed with antibodies to RAD21 and SMC1 in control GFP-KD (blue bar) or RAD21-KD COLO 320-DM (red bar). (Mean ± SEM, n = 3 biological replicates). 3′HS1 of the human β-globin locus (amplicon 4) and Necdin (amplicon 5) served as controls. (E) 3C assay of c-Myc in COLO 320-DM cells after RAD21-KD. DpnII restriction sites in c-Myc appear as gray shaded bars. Black shading indicates the anchor fragment of the 5′ CTCF binding sites of c-Myc. (Mean ± SEM, n = 3 biological replicates). (F) The expression of c-Myc was measured by qRT-PCR on day 60 after RAD21-KD in COLO 320-DM cells. Each value was normalized to that of 18S ribosomal RNA relative to the control GFP-shRNA expressing cells. The average of triplicate independent viral transduction experiments ± SD is presented. *P < 0.01. (G) A ChIP assay using previously published replication origin sequences near the c-Myc locus (70) was performed with antibodies against Pol α, CDC45 and MCM7 in control GFP-KD or RAD21-KD COLO 320-DM cells on day 60 after lentiviral transduction. (Mean ± SEM, n = 3 biological replicates).Figure 7.Proposed model for cohesin-mediated copy-number loss of highly amplified genes existing on DMs and HSRs in human cancer cells. APIP/PDHX/CD44 locus located in HSRs and DMs forms spatial chromatin organizations in SNU16 cells. Cohesin appeared to stabilize long-range chromatin interactions through direct interactions among CTCF/cohesin localization sites. Down-regulation of cohesin by RAD21-KD abolished the proximity between CTCF/Rad21 binding sites within these segments, thereby reducing APIP/PDHX/CD44 expression. After several passages, RAD21-KD decreases the enrichment of pre-RC at replication origins near these regions, result in reducing the copy numbers of amplified genes existing in HSRs and/or DMs in cancer cells. See text for more details.