
Int J Endocrinol. 2018;2018:9863050.
Changes in Body Compositions and Basal Metabolic Rates during Treatment of Graves' Disease.
제1저자 김민주 · 교신저자 조선욱
소속 (3)
- Department of Internal Medicine, Seoul National University Hospital, Seoul, Republic of Korea.
- Department of Food Service and Nutrition Care, Seoul National University Hospital, Seoul, Republic of Korea.
- Department of Internal Medicine, Seoul National University College of Medicine, Seoul, Republic of Korea.
Abstract
OBJECTIVES Because thyroid hormone is an important determinant of body weight and basal metabolic rate, we investigated the changes in the basal metabolic rate and body composition sequentially after treatment for Graves' disease.
METHODS A prospective cohort study was performed with six women newly diagnosed with Graves' disease. During a 52-week treatment of methimazole, body composition, resting respiratory expenditure (REE), and handgrip strength were measured consecutively.
RESULTS After methimazole treatment, body weight was initially increased (0-8 weeks), subsequently plateaued (8-24 weeks), and gradually decreased in the later period (24-52 weeks) despite the decreased food intake. The measured REE was 40% higher than the predicted REE at baseline, and it gradually decreased after treatment. REE positively correlated with thyroid hormone levels, peripheral deiodinase activity, and thyroid's secretory capacity. Body compositional analyses showed that the fat mass increased during an earlier period (4-12 weeks), while the lean mass increased significantly during the later period (26-52 weeks). Consistent with the lean mass changes, muscle strength also significantly increased during the later period.
CONCLUSIONS Treatment of Graves' disease increased body weight and fat mass transiently with decreased REE. However, long-term compositional changes moved in a beneficial direction increasing lean mass and reinforcing muscle strength, following decreasing fat percentages.
Figures

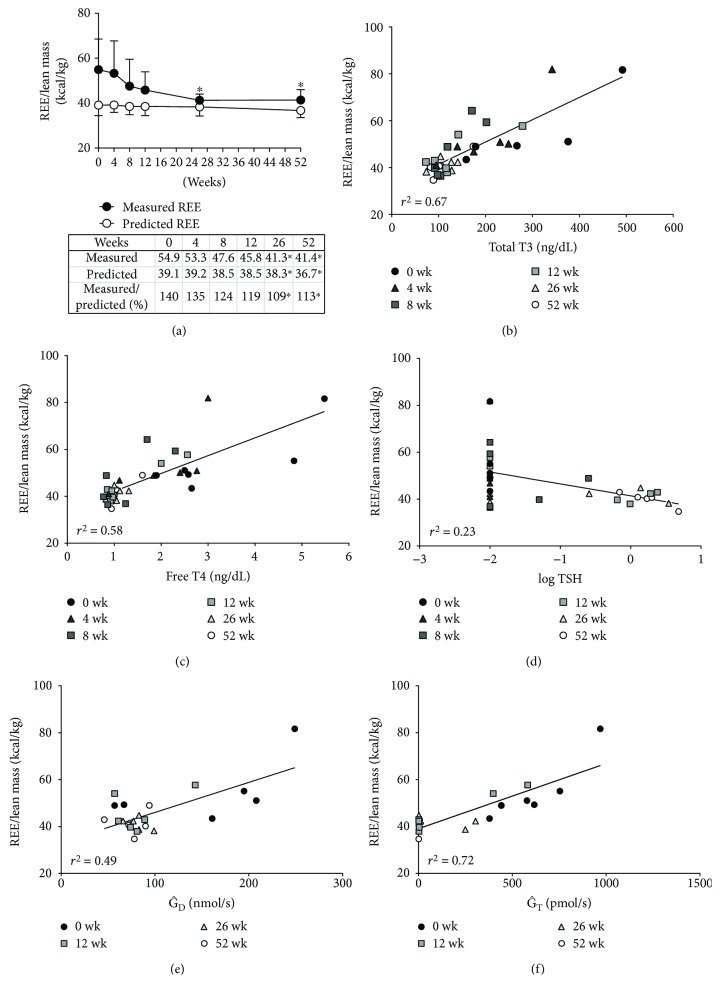
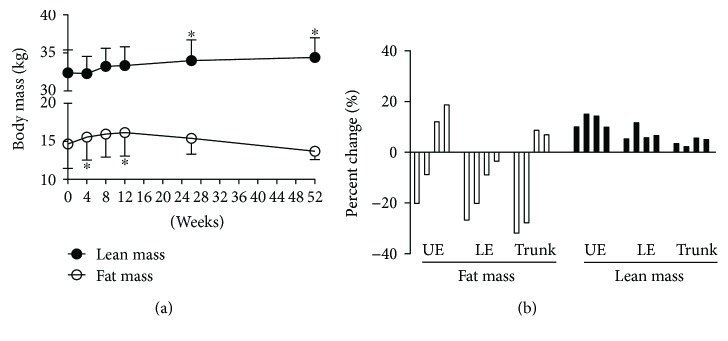
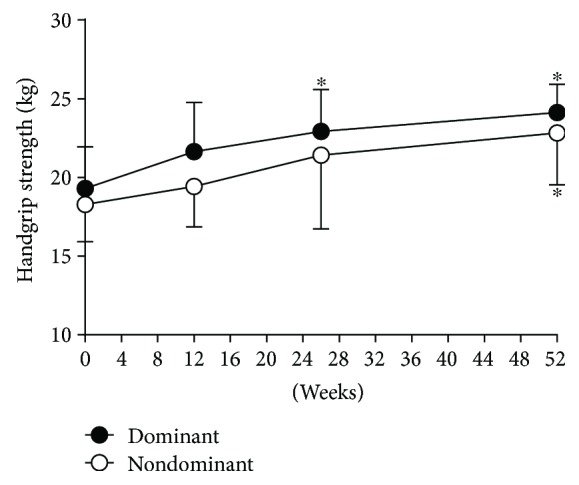
그림 출처: PubMed Central 공개 논문 (PMC5960571)
그 밖의 정보
- 출판 형태
- Journal Article
- 저널
- International journal of endocrinology · ISSN 1687-8337
- 전자 출판
- 2018-05-03
- 참고문헌
- 28편