Center of Cell- & Bio-Therapy for Heart, Diabetes, and Cancer, Seoul National University Hospital, Seoul, Korea.
Department of Molecular Medicine and Biopharmaceutical Sciences, Graduate School of Convergence Science and Technology, Seoul National University, Seoul, Korea.
Center of Cell- & Bio-Therapy for Heart, Diabetes, and Cancer, Seoul National University Hospital, Seoul, Korea. hyosoo@snu.ac.kr.
Department of Molecular Medicine and Biopharmaceutical Sciences, Graduate School of Convergence Science and Technology, Seoul National University, Seoul, Korea. hyosoo@snu.ac.kr.
Abstract
Angiopoietin-1 modulates vascular stability via Tie2 on endothelial cells. In our previous study, we also showed it acts as an inhibitor of cardiomyocyte death. However, it remains poorly understood how Ang1 regulates myogenesis during muscle regeneration. Here we found that COMP-Ang1 (cAng1) enhances muscle regeneration through N-cadherin activation. Muscle fiber regeneration after limb muscle damage by ischemic injury was enhanced with cAng1 treatment. Mechanistically cAng1 directly bound to N-cadherin on the myoblast surface in a Ca2+ dependent manner. The interaction enhanced N-cadherin activation via N-cadherin/p120-catenin complex formation, which in turn activated p38MAPK (but not AKT or ERK) and myogenin expression (but not myoD) as well as increasing myogenin+ cells in/ex vivo. After transplantation of GFP-expressing myoblasts (GFP-MB), we showed an increased generation of GFP+ myotubes with adenovirus cAng1 (Adv-cAng1) injection. Adv-cAng1, however, could not stimulate myotube formation in N-cadherin-depleted GFP-MB. Taken together, this study uncovers the mechanism of how cAng1 promotes myoblast differentiation and muscle regeneration through the N-cadherin/p120-catenin/p38MAPK/myogenin axis.
Figures
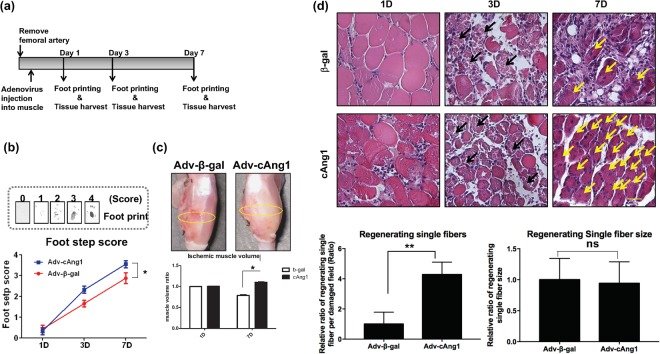
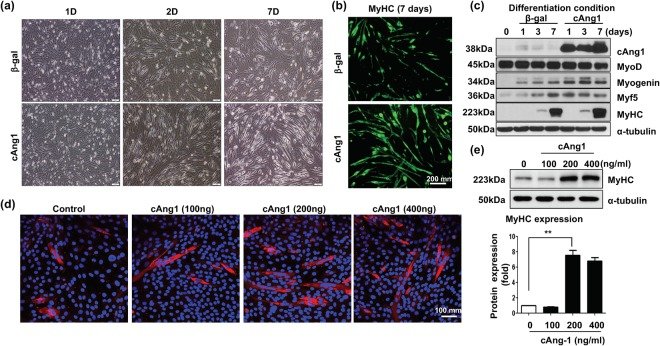
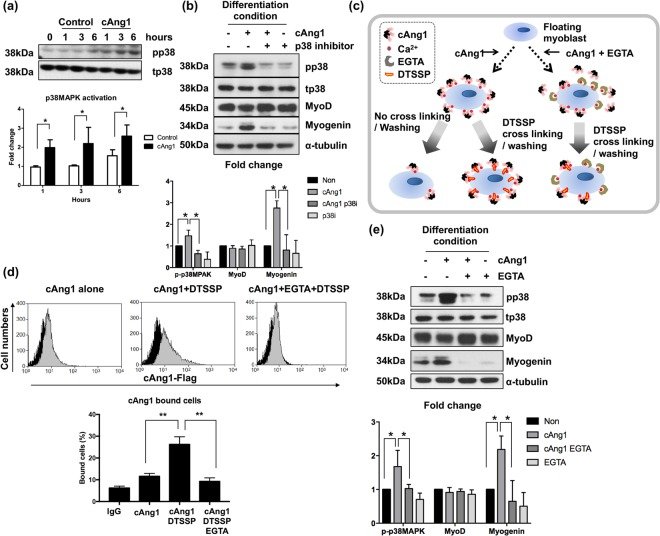
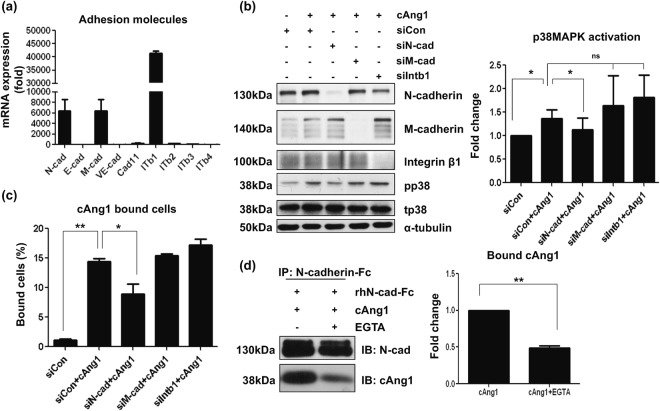
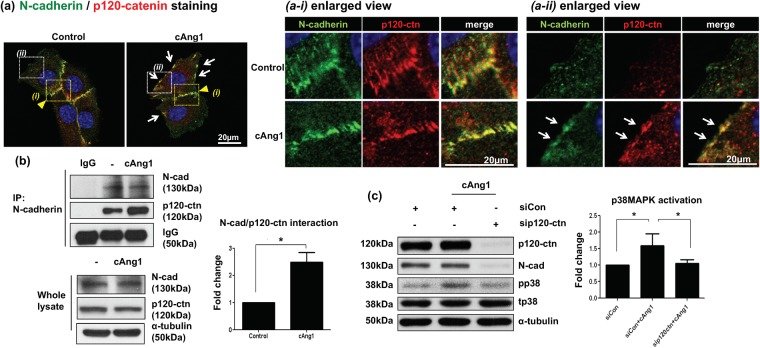
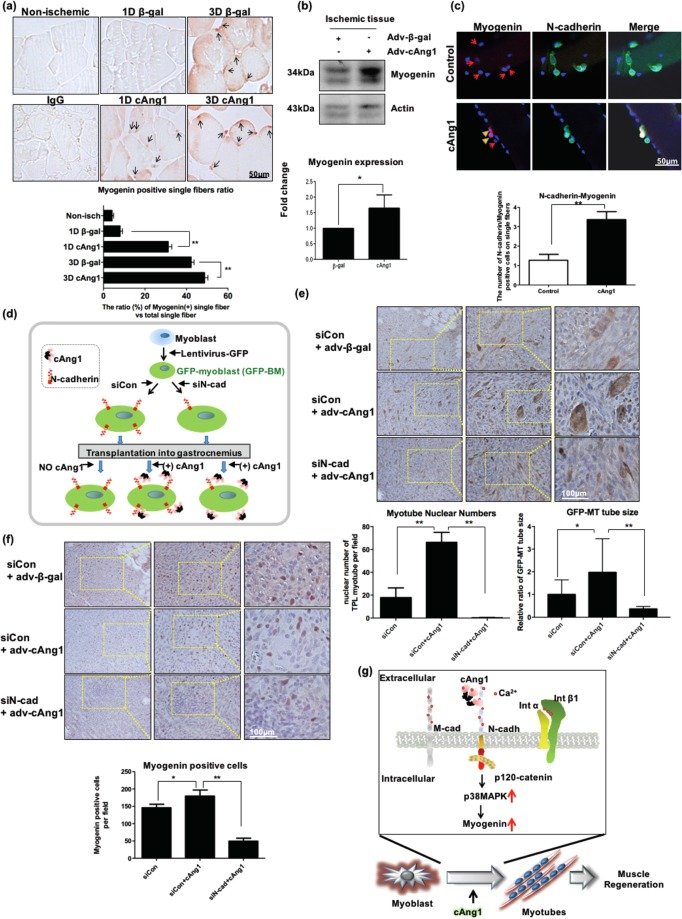
Figure 1cAng1 accelerates muscle regeneration after ischemic injury. (a) Timeline of the hindlimb ischemic model. (b) The foot recovery scores. Non-printing foot was indicated as a “0” score, only prints of touched foot was indicated as a “1” score, prints of the toe was indicated as a “2” score, prints of toes and sole of the foot was indicated as a “3” score, and prints of a fully recovered foot was indicated as a “4” score. The foot step scores of Adv-cAng1 mice (n = 5) were significantly higher than that of Adv-β-gal mice (n = 5), Mean value ± SEM, n = 5, *p < 0.05. (c) The measurement of muscle volume after ischemic injury. The muscle volume ratio was calculated by ischemic/normal gastrocnemius muscle at 1 and 7 days. Mean value ± SEM, n = 3, *p < 0.05. (d) Histology of ischemia damaged muscle on time dependent manner. Adv-cAng1 injection dramatically increased regenerating muscle fibers (yellow arrows) after ischemic injury at 7 days. Scale bar = 100 μm, Magnification, x200. The regenerating single fiber numbers were counted in damaged field area with image J, normalized by Adv-β-gal. The regenerating single fiber size on cross section was measured by image J and was normalized by Adv-β-gal.Figure 2cAng1 is a stimulator of myoblast differentiation. (a) Bright field images of C2C12 myoblast differentiation. After adenovirus infection, C2C12 were treated with differentiation media for 7 days. Scale bar = 200 μm. Magnification, x100. (b) Immunofluorescent staining of MyHC. Myoblast differentiation was evaluated with MyHC stain (green) at 7 days. Scale bar = 200 μm. Magnification, x100. (c) Immunoblot to confirm myogenesis in C2C12 myoblast. After adenovirus infection, C2C12 were harvested and analyzed myogenic markers such MyoD, myogenin, Myf5, and MyHC. cAng1 was detected by anti-Flag. α-tubulin was used to internal control. (d) The myotubes (MyHC, red) were increased by cAng1 in a dose dependent manner at 7 day differentiation. Cell nucleus was indicated on blue by DAPI staining. Scale bar = 100 μm. Magnification, x200. (e) Immunoblotting for MyHC after cAng1 treatment. The recombinant cAng1 concentration (200 and 400 ng/ml) enhanced MyHC expression in myoblasts after 3 days. Quantification graph for MyHC (fold). (Mean value ± SEM, n = 3, **P < 0.001).Figure 3cAng1 enhances myogenin expression through p38MAPK in a Ca2+ dependent manner. (a) Immunoblotting to confirm signaling molecules by cAng1 (200 ng/ml). Myoblasts were exposed to differentiation media and treated with cAng1. p38MAPK was activated by cAng1. Quantitative graph was made from three independent experiments (Mean value ± SEM, *P < 0.05). (b) cAng1 increased the myogenin expression at 1 day after differentiation, which was suppressed by treatment with the p38MAPK inhibitor (SB239063, 10 μM). MyoD expression was not changed by cAng1 or the p38MAPK inhibitor. p38MAPK activation was confirmed at 3 hours (Mean value ± SEM, n = 3, *P < 0.05). (c) Schematic diagram of surface binding experiment. Detached myoblasts were incubated with cAng1 and underwent cross-linking by DTSSP. EGTA was used as a Ca2+ ion chelating agent. The binding amount of cAng1 on the surface of myoblasts was evaluated with FACS. (d) The analysis of cAng1 binding capacity on the myoblast surface. The histogram indicated anti-Flag without cAng1 (black) as control and with cAng1 (gray). Without DTSSP, cAng1 could not stably bind on the myoblast surface. The stable binding amount of cAng1 was increased by DTSSP but reduced by EGTA (Mean value ± SEM, n = 4, **P < 0.01). (e) In the immunoblot analysis, cAng1 increased the p38MAPK phosphorylation at 3 hours and myogenin expression at 1 day, which was suppressed by EGTA. The quantification graph of myogenin expression ratio was shown (Mean value ± SEM, n = 3, *P < 0.05 and **P < 0.01).Figure 4cAng1 directly binds to N-cadherin on the myoblast surface. (a) mRNA levels of adhesion molecules in myoblasts. N-cadherin (N-cad), M-cadherin (M-cad) and integrin β1 (ITb1) were abundantly expressed in myoblasts. The relative value was based on E-cadherin (E-cad) expression. ITb2, integrin β2; ITb3, integrin β3; ITb4, integrin β4. (b) Western blotting after knockdown with siRNA. Each sample was transfected with siRNA against N-cadherin (siN-cad), M-cadherin (siM-cad), and Integrin β1 (siIntb1). Knockdown of N-cadherin significantly inhibited p38MAPK activation in the presence of cAng1 at 3 hours. The knockdown of M-cadherin or integrin β1 did not significantly influence cAng1 effects on p38MAPK activation, respectively. Quantification graph of the p38MAPK phosphorylation ratio was assessed by densitometry of different immunoblots (Mean value ± SEM, n = 4, *P < 0.05 and n.s. = none signification). (c) cAng1 binding assay to target adhesion molecules. The surface binding of cAng1 on myoblasts was significantly reduced by siN-cadherin, but not by siM-cadherin or siIntegrin β1. The graph of cAng1 binding capacity was assessed with different FACS analyses (Mean value ± SEM, n = 3, *P < 0.05 and **P < 0.01). (d) The in vitro binding assay for N-cadherin with cAng1. The interaction between human N-cadherin-Fc and cAng1-Flag was confirmed with anti-Flag and anti-N-cadherin antibody. The pull-downed cAng1 by anti-N-cadherin-antibody was detected with anti-Flag antibody, which was significantly reduced by EGTA treatment (Mean value ± SEM, n = 3, **P < 0.01).Figure 5cAng1 activates N-cadherin by enhancing the formation of N-cadherin/p120-catenin complex. (a) Immunofluorescent staining for N-cadherin and p120-catenin. At the cell junction site (yellow arrowhead, a-i enlarged view), N-cadherin (green) and p120-catenin (p120-ctn, red) were co-localized regardless of cAng1 presence. At the non-junctional cell periphery (white arrows, a-ii enlarged view), however, co-localization of N-cadherin and p120-catenin was observed only in the presence of cAng1. Cell nucleus was indicated in blue by DAPI staining. Scale bar = 20 μm. Magnification, x630. (b) Immunoprecipitation analysis of N-cadherin and p120-catenin. cAng1 stimulated the association of N-cadherin with p120-catenin without affecting their protein amount. Quantitative graph of p120-catenin (Mean value ± SEM, n = 3, *P < 0.05). (c) Immunoblotting after p120-catenin depletion with siRNA. The siRNA against p120-catenin was transfected into myoblasts and the cells were threated under differentiation conditions. p120-catenin depletion reduced N-cadherin protein levels and inhibited p38MAPK phosphorylation at 3 hours in the presence of cAng1. The graph of p38MAPK phosphorylation ratio was assessed with densitometry of different immunoblots (Mean value ± SEM, n = 3, *P < 0.05).Figure 6N-cadherin is important in myogenin expression in ischemic muscle and the cAng1-induced myotube formation of transplanted myoblasts. (a) Immunohistochemistry for myogenin in muscles at 1 and 3 days. Myogenin-expressing single fibers were identified with brown (myogenin) nuclei in muscle. Scale bar = 50 μm, Magnification, x400. Myogenin positivity was evaluated by counting the myogenin signal on single fibers and the ratio was assessed by normalization with total myofiber numbers in the field (0.47 mm × 0.63 mm). (n = 3, **P < 0.01). (b) Immunoblot analysis for myogenin in ischemic muscle at 1 day. Myogenin positive single fibers were increased by Adv-cAng1 compared to control. The quantitative graph of myogenin positive single fibers (n = 3, *P < 0.05). (c) The immunofluorescent staining of N-cadherin and myogenin on ex vivo single fibers. The single fibers were treated with differentiation media with or without cAng1 for 2 days. cAng1 enhanced myogenin expression of N-cadherin+ satellite cells on single fibers. The quantitative graph of N-cadherin-myogenin (n = 5, *P < 0.05). (d) Schematic diagram of myoblast transplantation experiment with N-cadherin knockdown. The GFP-expressing myoblasts (GFP-MB) were transfected with siRNA against N-cadherin or siControl. Each GFP-MB was transplanted into the gastrocnemius muscle of a nude mouse and then Adv-cAng1 or Adv-β-gal was injected. (e) The transplanted myoblasts were confirmed with anti-GFP antibody (brown) by immunohistochemistry. GFP-expressing myotubes (GFP-MT) generated from GFP-MB in mouse muscles were strongly stained as brown. The myotube generation in cAng1-treated groups was increased compared to control groups. However, N-cadherin knockdown myoblasts poorly generated GFP-MT. Scale bar = 100 μm, Magnification, x200. The nuclear numbers and the size of myotubes were analyzed in field (0.47 mm × 0.63 mm) (n = 3, **P < 0.01). (f) Immunohistochemistry for myogenin. Myogenin positive cells (red) were increased in the cAng1 treated group compared with control. In contrast, myogenin positive cells were dramatically reduced in the transplanted group of N-cadherin knockdown GFP-MB. Scale bar = 100 μm, Magnification, x200. The myogenin positive cells were counted on field (0.47 mm × 0.63 mm) (n = 3, *P < 0.05 and **P < 0.01). (g) Proposed model for myoblast differentiation and muscle regeneration through the cAng1/N-cadherin/p120-catenin/p38MAPK axis.