Department of Bioscience and Biotechnology, Konkuk University, Seoul, Republic of Korea.
Department of Mechanical Engineering, Hanbat National University, Daejeon, Republic of Korea.
Department of Internal Medicine, Seoul National University Bundang Hospital, Seongnam, Republic of Korea.
Company of BioSquare, Hwaseong, Republic of Korea.
Division of Science Education, Kangwon National University, Chuncheon, Republic of Korea.
College of Medicine, Seoul National University, Seoul, Republic of Korea.
Department of Bioscience and Biotechnology, Konkuk University, Seoul, Republic of Korea. susia45@gmail.com.
Department of Mechanical Engineering, Hanbat National University, Daejeon, Republic of Korea. jsong@sogang.ac.kr.
Department of Mechanical Engineering, Sogang University, Seoul, Republic of Korea. jsong@sogang.ac.kr.
Department of Internal Medicine, Seoul National University Bundang Hospital, Seongnam, Republic of Korea. ljc0316@snubh.org.
College of Medicine, Seoul National University, Seoul, Republic of Korea. ljc0316@snubh.org.
Department of Medicine, Brigham and Women's Hospital, Harvard Medical School, Harvard University, Boston, MA, USA. lplee@harvard.edu.
Department of Bioengineering, University of California, Berkeley, CA, USA. lplee@harvard.edu.
Department of Electrical Engineering and Computer Science, University of California, Berkeley, CA, USA. lplee@harvard.edu.
Korea Biomedical Institute for Global Health Research and Technology (K-BIGHEART), Pohang University of Science and Technology (POSTECH), Pohang, Republic of Korea. lplee@harvard.edu.
Department of Bioscience and Biotechnology, Konkuk University, Seoul, Republic of Korea. bjun@konkuk.ac.kr.
Abstract
Pancreatic ductal adenocarcinoma (PDAC) has a relatively low incidence but a high mortality rate, primarily due to difficulties in early detection. Current state-of-the-art methods for diagnosing early-stage PDAC tend to be invasive, time-consuming, and unreliable, primarily due to the difficulties associated with the early detection of pancreatic cancers. Here we show a quick and sensitive method for the early diagnosis of PDAC using a signal-enhanced lateral flow immunoassay called SELFI. We develop SELFI, which generates a strong colorimetric signal through multiple hotspots formed by plasmonic gold nanoparticles (AuNPs) assembled on a silica nanoparticle. Our SELFI assay achieves a 10,123-fold increase in the limit of detection compared to conventional lateral flow immunoassays using 20 nm AuNPs, providing results within 15 min. We demonstrate that SELFI enables early diagnosis of PDAC, as indicated by a receiver operating characteristic curve and a larger area under the curve compared to the enzyme-linked immunosorbent assay. SELFI's effective diagnostic features can enhance the timely identification of PDAC and may also serve in the early diagnosis of a range of other diseases.
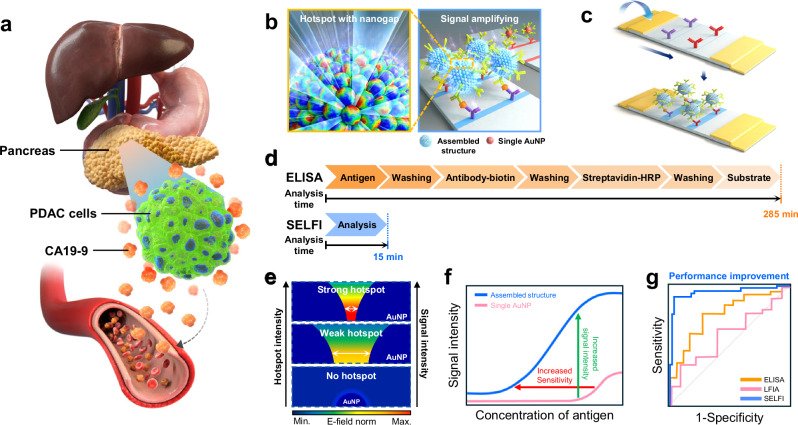
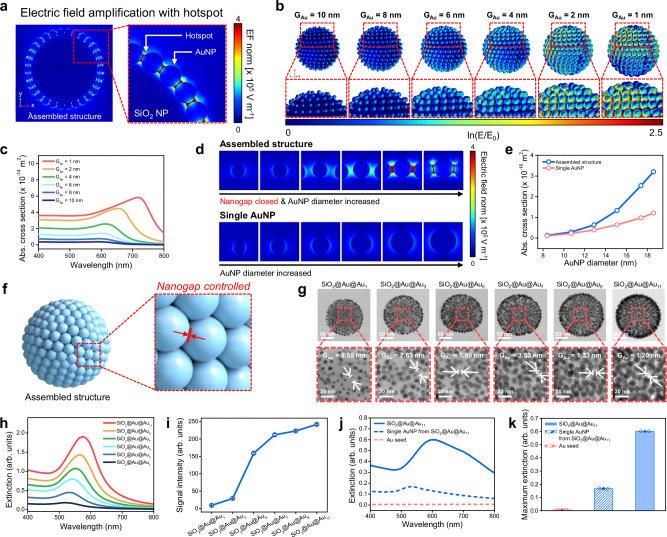
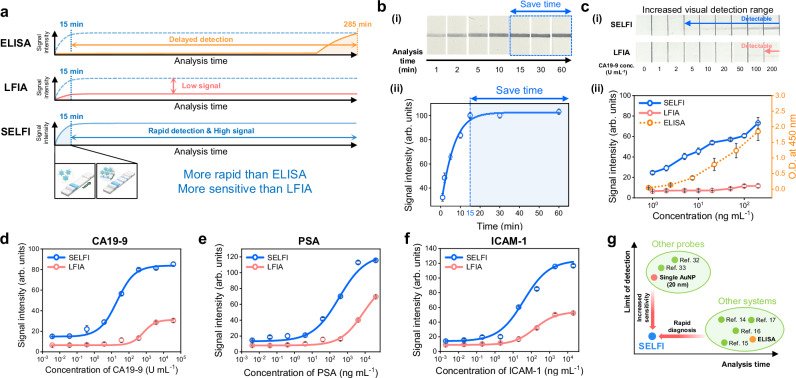
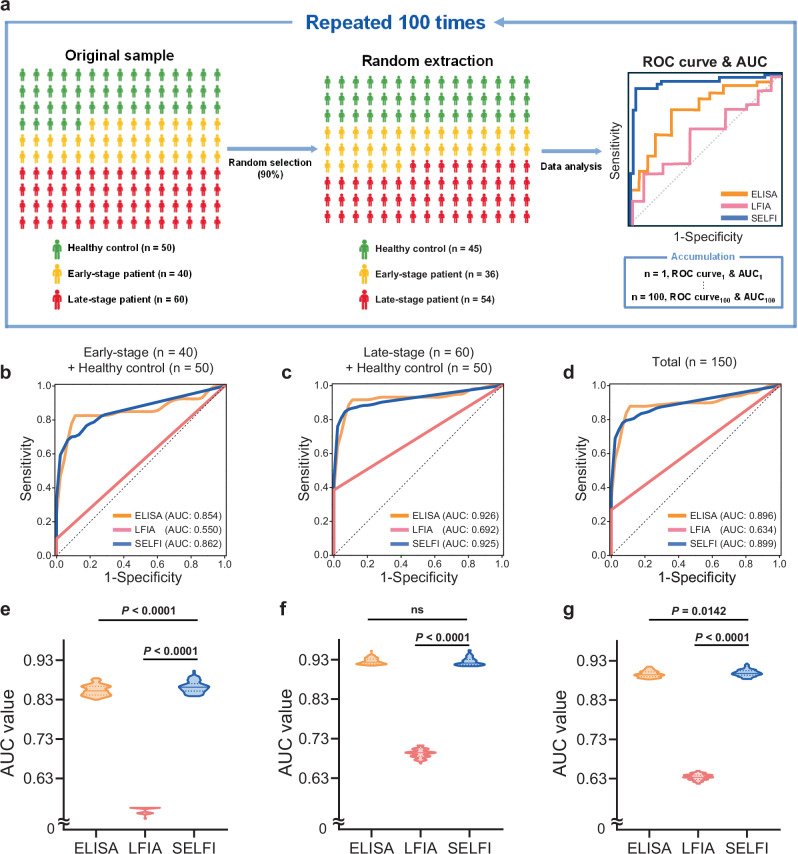
Fig. 1 Quantification analysis of CA19-9 for early diagnosis of PDAC using the SELFI system. a Illustration of the pancreas and PDAC cells. PDAC cells are located in the pancreas, which is situated at a deep anatomical location. Overexpressed CA19-9 by PDAC cells is released into the bloodstream and elevates the CA19-9 level in serum samples. b Illustration of the assembled structure of the nanoprobe. Fabricated nanoprobes have multiple hotspots with nanogap that amplify the colorimetric signal. c Schematic illustration of the SELFI system for PDAC diagnosis. The colorimetric signal at the test line is generated by the binding of nanoprobes to the test line of the strip via interactions between CA19-9 and CA19-9 antibodies. d Comparison of the SELFI system with ELISA, one of the conventional methods for biomarker quantification analysis. The SELFI system required only 15 min for analysis, whereas ELISA required 285 min. e Changes of E-field norm and colorimetric signal intensity of nanoprobes according to the gap distance between AuNPs. As the gap distance between AuNPs decreases, the E-field norm increases due to the generation of strong hotspots. f Model test for CA19-9 detection using LFIA, in which single 20 nm AuNPs were used as colorimetric nanoprobes, and SELFI. Compared with single AuNP-based LFIA, SELFI, which uses colorimetric nanoprobes with an assembled nanostructure, exhibited increased signal intensity and a wider dynamic range. g Schematic illustration of the ROC curve for PDAC diagnosis using ELISA (orange line), LFIA (red line), and SELFI (blue line). The gray dotted line represents a random classifier.Fig. 2 Design with numerical simulation, fabrication, and characterization of colorimetric nanoprobes for SELFI. a Maximum electric field amplification of the assembled nanostructure induced by hotspots between AuNPs on SiO2 NP. b Electric field distribution at peak wavelength depending on GAu. c Absorption cross-section spectra depending on GAu. d Comparison of electric field norm distribution (at each peak wavelength) between a single AuNP and an AuNP on the assembled nanostructure, depending on AuNP diameter. e Absorption cross-section intensity of a single AuNP (red line) and an AuNP on the assembled nanostructure (blue line) at peak wavelength, depending on AuNP diameter. f Schematic illustration of fabricated nanoprobes with an assembled nanostructure. AuNPs were located onto the surface of SiO2 nanotemplates with controlled nanogaps. g Cs-STEM images of fabricated SiO2@Au@Au1, SiO2@Au@Au3, SiO2@Au@Au5, SiO2@Au@Au7, SiO2@Au@Au9, and SiO2@Au@Au11. The average gap distances between AuNPs were 9.55, 7.63, 5.89, 3.53, 1.33, and 1.20 nm, respectively. GAu was measured from 20 individual AuNP–AuNP gap measurements per condition, obtained from a representative Cs-STEM image (n = 20 individual measurements). Scale bars, 50 nm (upper images) and 20 nm (lower images). h UV–vis extinction spectra of fabricated NPs. i Colorimetric signal intensities of fabricated NPs on NC membrane. The colorimetric signal intensity was measured using the ImageJ software. Quantitative data represent mean ± SD from three independent experiments, each performed using separately prepared batches from the same sample (n = 3). j UV–vis extinction spectra of SiO2@Au@Au11 (blue solid line), AuNPs from SiO2@Au@Au11 (blue dotted line), and 3–5 nm AuNPs (red dotted line). k Extinction at λmax.ext of SiO2@Au@Au11 (blue filled bar), AuNPs from SiO2@Au@Au11 (blue hatched bar), and 3–5 nm AuNPs (red hatched bar). Bars represent mean ± SD, with individual data points shown as jittered dots from three independent experiments, each performed using separately prepared batches from the same sample (n = 3).Fig. 3 Model test for quantification of CA19-9 using SELFI. a Schematic illustration of time-dependent signal intensity from ELISA, conventional LFIA, and SELFI during biomarker quantification analysis. b-i Photographs of the NC membrane after CA19-9 quantification analysis depending on the analysis time. ii Signal intensity graph as a function of analysis time. The concentration of CA19-9 in the analyte sample was 3700 U mL−1, and the calibration curve was fitted using the Boltzmann model. c-i Photographs of the NC membrane after developing the CA19-9 solution with SELFI and LFIA, depending on the concentration of CA19-9. ii Signal intensity graph as a function of CA19-9 concentration. The blue line, red line, and orange dotted line represent signals from SELFI, LFIA, and ELISA, respectively. The gray dotted line represents the boundary for naked-eye detection in SELFI and LFIA. d Calibration curve for CA19-9 quantification. e Calibration curve for PSA quantification. f Calibration curve for ICAM-1 quantification. g Comparison of SELFI for PDAC diagnosis with other LFIA-based diagnostic systems and other diagnostic systems, including ELISA. For b–f, the colorimetric signal intensity was measured using the ImageJ software. For d–f, the blue line and circles represent the results using SELFI, while the red line and circles represent the results using LFIA. For d–f, the calibration curves were fitted using sigmoidal curves. Quantitative data represent mean ± SD from three independent experiments, each performed using separately prepared batches from the same sample (n = 3). Representative images are shown.Fig. 4 Diagnosis of PDAC with clinical serum samples using ELISA, LFIA, and SELFI. a Schematic illustration of the statistical data analysis process. b Average ROC curve for ELISA, LFIA, and SELFI using samples from early-stage PDAC patients and healthy controls (area under the curve (AUC): ELISA = 0.854, LFIA = 0.550 and SELFI = 0.862). c Average ROC curve for ELISA, LFIA, and SELFI using samples from late-stage PDAC patients and healthy controls (AUC: ELISA = 0.926, LFIA = 0.692 and SELFI = 0.925). d Average ROC curve for ELISA, LFIA, and SELFI using total samples (AUC: ELISA = 0.896, LFIA = 0.634 and SELFI = 0.899). e Violin plot of AUC values for ELISA, LFIA, and SELFI using samples from early-stage PDAC patients and healthy controls (P < 0.0001, two-sided Student’s t test). f Violin plot of AUC values for ELISA, LFIA, and SELFI using samples from late-stage PDAC patients and healthy controls. Two-sided Student’s t test shows a significant difference between LFIA and SELFI (P < 0.0001), but not between ELISA and SELFI (ns; P = 0.3363). g Violin plot of AUC values for ELISA, LFIA, and SELFI using total samples. Statistical significance was assessed using a two-sided Student’s t test (ELISA vs. SELFI, P = 0.0142; LFIA vs. SELFI, P < 0.0001). For b–g, data from ELISA, LFIA, and SELFI are depicted in orange, red, and blue, respectively. The ROC curves and AUC values were obtained using a homemade R program code with the pROC library. For b–d, the average ROC curves were obtained by averaging 100 ROC curves using linear interpolation, with the black dotted line representing a random classifier. For e–g, the median value is depicted as a solid line, and the interquartile range boundaries are depicted as dotted lines in each violin plot.
그림 출처: PubMed Central 공개 논문 (PMC13018180)
Conflict of interest statement
Competing interests: The authors declare no competing interests.