College of Pharmacy, Seoul National University, Seoul, Republic of Korea.
Department of Internal Medicine, Seoul National University College of Medicine, Seoul, Republic of Korea.
Division of Endocrinology and Metabolism, Department of Internal Medicine, Seoul Metropolitan Government Boramae Medical Center, Seoul, Republic of Korea.
Division of Gastroenterology and Hepatology, Department of Internal Medicine, Seoul Metropolitan Government Boramae Medical Center, Seoul, Republic of Korea.
Research Institute of Pharmaceutical Sciences and Natural Products Research Institute, College of Pharmacy, Seoul National University, Seoul, Republic of Korea.
Abstract
Elevated liver stiffness is closely associated with morbidity and mortality in metabolic dysfunction-associated steatotic liver disease (MASLD). However, the contribution of increased stiffness to impaired liver function is poorly understood. Here, we demonstrate that hepatic cholesterol levels are determined by the stiffness of the liver. In the human MASLD cohort and a mouse model, intrahepatic cholesterol levels strongly correlated with liver stiffness. We show that a stiff matrix promotes spontaneous accumulation of cholesterol in isolated hepatocytes. As the underlying mechanism, we found that Liver X receptor alpha (LXRα) is mechanosensitively repressed. Activation of Yes-associated protein (YAP) and Transcriptional coactivator with PDZ-binding motif (TAZ) by exposure to stiff substrate, serum stimulation, low-density culture, or deletion of Large tumor suppressor kinase 1 and 2 (LATS1/2) robustly repressed LXRα activity. In the nucleus, YAP disrupted heterodimerization of LXRα with Retinoid X receptor alpha (RXRα) independently of their transcriptional activity. Consistently, hepatocyte-specific ablation of Yap/Taz facilitated hepatic cholesterol efflux and delayed cholesterol-induced fibrosis progression in mice. Transcriptomic analysis of MASLD patient livers confirmed a strong inverse correlation between LXRα target gene expression and liver stiffness as well as YAP/TAZ activity. These findings reveal the mechanosensitive regulation of hepatic cholesterol levels in MASLD, suggesting liver stiffness as a causal factor for hepatocyte dysfunction.
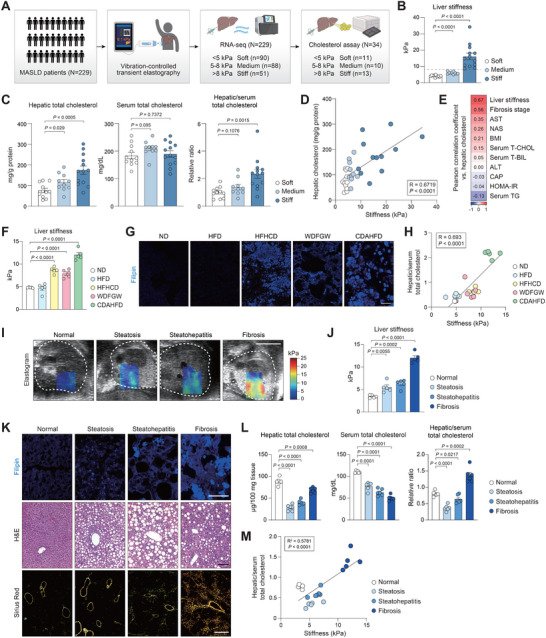
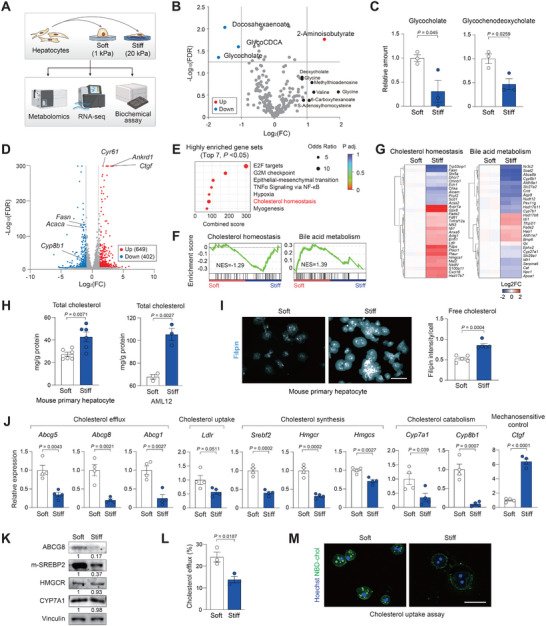
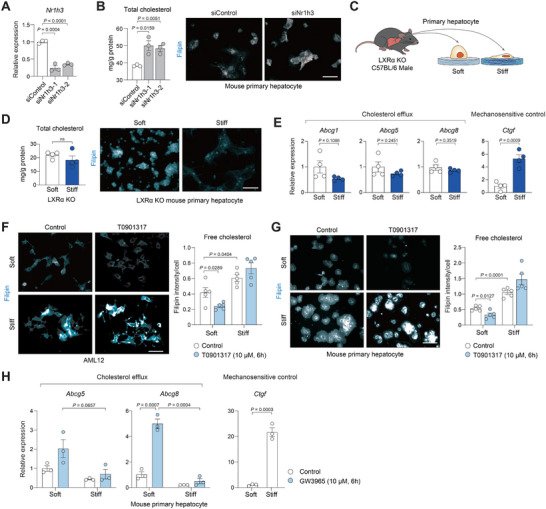
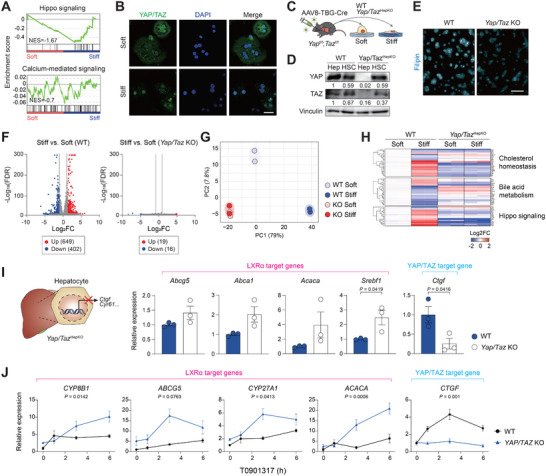
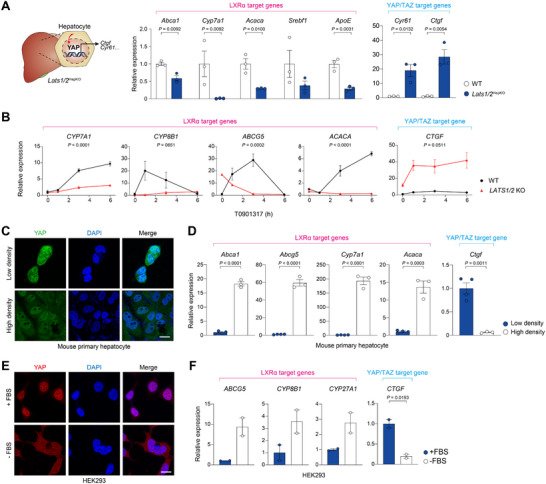
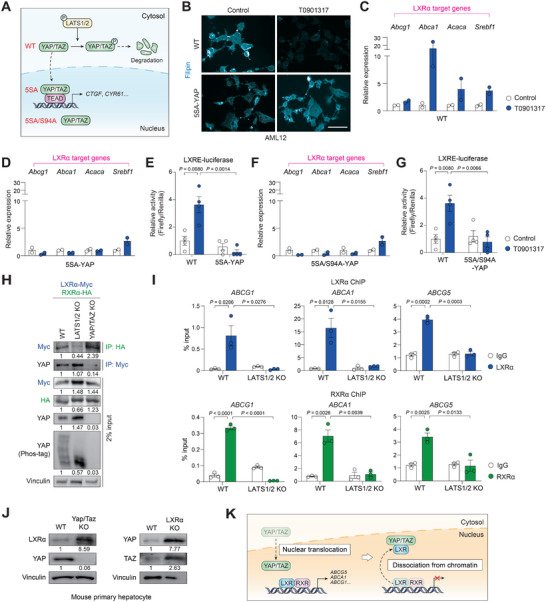
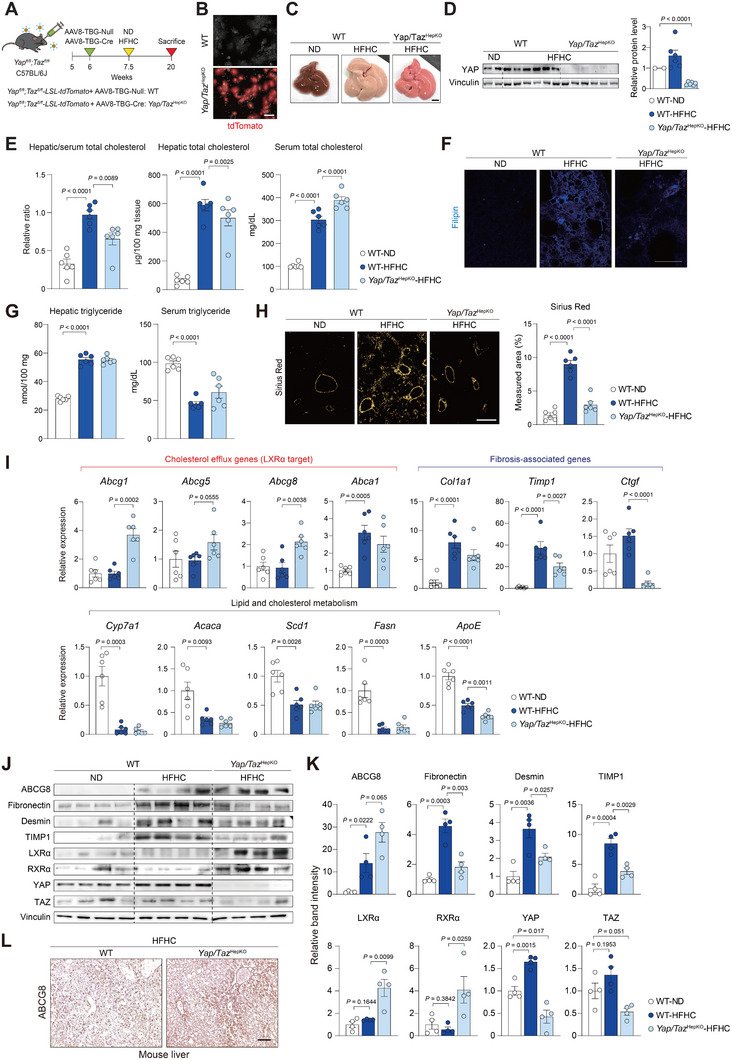
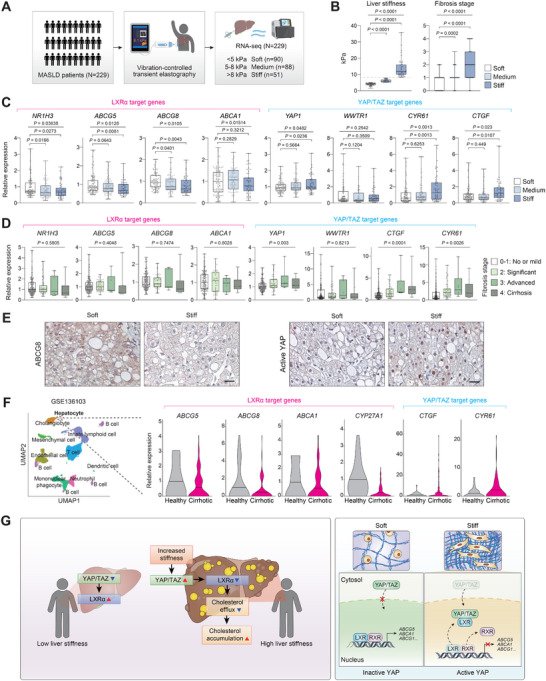
FIGURE 1Hepatic cholesterol content correlates with tissue stiffness in MASLD. (A—E) MASLD patients were subjected to transient elastography and routine blood exams. Liver biopsies were taken and analyzed for RNA‐sequencing and hepatic cholesterol quantification. (A) Study design. Patients were categorized into Soft (<5 kPa, n = 11), Medium (5–8 kPa, n = 10), and Stiff (>8 kPa, n = 13) groups based on liver stiffness. (B) Liver stiffness of MASLD patients was categorized into different groups. The dotted line indicates 8 kPa. (C) Total cholesterol levels in the liver and serum. The relative ratio of liver‐to‐serum cholesterol levels was compared. Liver cholesterol levels were normalized to the protein content. (D) Correlation between hepatic cholesterol level and liver stiffness (n = 11, 10, and 13). (E) Correlation heatmap of clinical parameters compared with hepatic cholesterol. The numbers represent Pearson correlation coefficients. (F—H) Mice were fed a normal diet (ND) or high‐fat diet (HFD) or high‐fat, high‐cholesterol diet (HFHCD) or western diet with fructose and glucose water (WDFGW), or choline‐deficient, amino acid‐defined, high‐fat diet (CDAHFD) for 12 weeks (n = 5). (F) Quantification of liver stiffness measured by SWE. (G) Filipin staining of liver sections. Scale bars, 50 µm. (H) Positive correlation between liver‐to‐serum cholesterol and liver stiffness. (I—M) Mice were fed CDAHFD for 0, 2, 4, and 12 weeks to induce steatosis, steatohepatitis, and fibrosis, respectively (n = 6). (I) Representative ultrasound images from mice at indicated times of feeding. Liver stiffness was visualized using shear wave elastography (SWE). Dotted lines indicate livers. Scale bar, 5 mm. (J) Quantification of liver stiffness measured by SWE (n = 5). (K) Filipin, H&E, and Sirius Red staining of liver sections from mice fed with CDAHFD. Sirius Red were additionally observed under polarized light for quantification of collagen fibrosis. Scale bars, 50 µm. (L) Total cholesterol levels in the liver and serum. The relative ratio of liver‐to‐serum cholesterol levels was compared. Liver cholesterol levels were normalized to the tissue weight. (M) Positive correlation between hepatic cholesterol and liver stiffness in CDAHFD (n = 5). Data are presented as the mean ± s.e.m. p values across more than two groups were determined by one‐way ANOVA with Bonferroni's multiple comparisons test. p‐values for individual groups compared to control were determined by unpaired Student's t‐test.FIGURE 2Matrix stiffness determines intracellular cholesterol level in hepatocytes. (A) Study design. Hepatocytes were cultured on soft (1 kPa) or stiff (20 kPa) polyacrylamide hydrogel coated with collagen. After 24 h, metabolites, RNA‐seq, and biochemical assay were analyzed. (B and C) AML12 cells were cultured for 24 h on soft or stiff polyacrylamide hydrogel coated with collagen. (B) Volcano plot of the intracellular metabolite profile (n = 3). Significantly altered metabolites are labeled. Colored dots indicate upregulated (red) or downregulated (blue) metabolites. (C) Relative level of downregulated metabolites on stiff hydrogel (n = 3). (D–G) Mouse primary hepatocytes were cultured for 24 h on soft or stiff hydrogel and subjected to analyses. (D) Volcano plot of RNA‐seq data showing differentially expressed genes (n = 2). Genes involved in cholesterol metabolism and YAP/TAZ target genes are labeled. Colored dots indicate increased (red) or decreased (blue) genes. (E) Hallmark gene set enrichment analysis showing the top 7 significantly altered pathways from RNA‐seq data. (F) GSEA on cholesterol homeostasis and bile acid metabolism from the differentially expressed genes. (G) Heatmap of differentially expressed genes that are related to cholesterol and bile metabolism in hepatocytes. (H) Total cholesterol levels were measured in mouse primary hepatocytes (n = 6) and AML12 (n = 3). (I) Filipin staining images and quantification of free cholesterol intensity of primary hepatocytes. Same number of cells were seeded. Scale bars, 50 µm. (J) RT–qPCR analysis of cholesterol metabolism‐related genes and the mechanosensitive control gene (n = 4). (K) Immunoblot analysis of rate‐limiting proteins of cholesterol regulation. Numbers below each band indicate the relative densitometric values normalized to Vinculin. (L) Cholesterol efflux (%) was calculated from the ratio of fluorescence intensity in the supernatant to the total fluorescence in the supernatant and cell lysate (n = 3). (M) NBD‐Cholesterol uptake assay of primary hepatocytes. Nucleus were stained with Hoechst 33342 (blue) and intracellular cholesterol (green) by fluorescence. Quantification of relative cholesterol of primary hepatocytes (n = 5). Scale bars, 50 µm. Data are presented as the mean ± s.e.m. p values were determined by unpaired Student's t‐test.FIGURE 3LXRα activity is controlled by matrix stiffness. (A and B) Mouse primary hepatocytes were transfected with siControl or siNr1h3 (LXRα) for 24 h. (A) RT–qPCR analysis of Nr1h3 expression (n = 3). (B) Total cholesterol quantification and Filipin staining of free cholesterol in mouse primary hepatocyte transfected with control or Nr1h3 siRNA (n = 3). Scale bars, 50 µm. (C—E) Primary hepatocytes isolated from LXRα KO mice were cultured on soft or stiff hydrogel for 24 h. (C) Experimental scheme. (D) Total cholesterol levels and free cholesterol for Filipin staining images in the primary hepatocytes. Scale bar, 50 µm. (E) RT‐qPCR analysis of genes regulating cholesterol efflux and metabolism (n = 4). (F) Images and quantification of free cholesterol intensity in AML12. Scale bars, 50 µm. AML12 cells were cultured on soft or stiff hydrogels for 24 h and treated with T0901317 (10 µM) for 6 h. (G) Filipin staining images and quantification of free cholesterol intensity in mouse primary hepatocytes. Mouse primary hepatocytes were cultured on soft or stiff hydrogels for 24 h and treated with T0901317 (10 µM) for 6 h Scale bar, 50 µm. (H) RT‐qPCR analysis of cholesterol efflux‐related genes (n = 3). Primary hepatocytes from wild‐type mice were cultured on soft or stiff hydrogels for 24 h and treated with GW3965 (10 µM) for 6 h. Data are presented as the mean ± s.e.m. p values were determined by unpaired two‐tailed Student's t‐test.FIGURE 4YAP/TAZ mediate mechanotransduction signal to promote cholesterol accumulation in hepatocytes. (A) Gene set enrichment analysis on Hippo signaling and calcium mediated signaling from the differentially expressed genes. (B) Immunofluorescence for YAP/TAZ (green) and DAPI (blue) in mouse primary hepatocytes cultured on soft or stiff hydrogel for 24 h. Scale bar, 50 µm. (C–H), AAV8‐TBG‐Cre or AAV8‐TBG‐Null control virus was injected to Yap/Tazfl/fl mice to yield hepatocyte‐specific Yap/Taz knockout (Yap/TazHepKO) or wild‐type (WT) mice, respectively. Each mouse retro‐orbitally received 1 × 10¹⁰ genomic copies. Primary hepatocytes were isolated after 10 days. (C) Experimental scheme. Primary hepatocytes and hepatic stellate cells from wild‐type and Yap/TazHepKO were cultured on soft or stiff hydrogel for 24 h. (D) Immunoblot analysis of hepatocytes (Hep) and hepatic stellate cells (HSC) from Yap/TazHepKO or WT mice. Numbers below each band indicate the relative densitometric values normalized to Vinculin. (E) Filipin staining of primary hepatocytes of the indicated genotype. Scale bar, 50 µm. (F) Volcano plots of RNA‐seq data (n = 2). Gene expression from wild‐type (left) and Yap/Taz KO (right) primary hepatocytes cultured on stiff hydrogel vs. soft hydrogel was compared. (G) Principal component analysis (PCA) of metabolic pathways based on gene expression (n = 2). (H) Heatmap of differentially expressed genes involved in cholesterol metabolism, bile metabolism, and Hippo signaling pathways (n = 2). (I) RT‐qPCR analysis of LXRα target genes in wild‐type and Yap/Taz KO hepatocytes (n = 3). The data represent the mean ± s.e.m. p values were determined by an unpaired two‐tailed Student's t‐test. (J) RT‐qPCR analysis for LXRα activity in wild‐type and YAP/TAZ KO HEK293 cells (n = 3). Cells were treated with T0901317 (10 µM) for the indicated times. Statistical significance was determined by two‐way ANOVA, and p‐values indicate the interaction between genotype and time.FIGURE 5YAP/TAZ activity regulates LXRα signaling and cholesterol metabolism. (A) RT‐qPCR analysis of LXRα target genes involved in cholesterol metabolism (n = 3). Bulk livers from Lats1/2HepKO or WT mice were analyzed. (B) RT‐qPCR analysis of LXRα target gene induction in wild‐type and LATS1/2 KO HEK293 cells (n = 2). Cells were serum‐starved for 15 h and treated with T0901317 (100 µM) for the indicated times. Statistical significance was determined by two‐way ANOVA, and p‐values indicate the interaction between genotype and time. (C and D) Mouse primary hepatocytes cultured at low (30% confluence) or high (100% confluence) density for 24 h. (C) Immunofluorescence for YAP/TAZ (green) and DAPI (blue). (D) Effect of cell density on LXRα activity (n = 4 or 3). RT‐qPCR analysis of LXRα target gene induction is shown. (E and F) HEK293 cells with serum‐starved for 15 h. (E) Immunofluorescence for YAP/TAZ (red) and DAPI (blue). (F) Effect of serum starvation on LXRα activity (n = 2). RT‐qPCR analysis of LXRα target gene induction is shown. Data are presented as the mean ± s.e.m. p‐values were determined by an unpaired two‐tailed Student's t‐test. ns, not significant.FIGURE 6Direct association with YAP inhibits LXRα in the nucleus. (A) A schematic diagram showing the location of YAP with different mutations. In contrast to wild‐type (WT), 5SA mutant is constitutively nuclear due to the lack of phosphorylation by LATS1/2. 5SA/S94A mutant resides in the nucleus but can neither interact with TEAD or induce its canonical target genes. (B) Filipin staining. AML12 cells stably expressing wild‐type YAP or 5SA‐YAP were serum‐starved overnight and treated with T0901317 (10 µM) for 6 h. Scale bar, 50 µm. (C) RT‐qPCR analysis of LXRα target gene induction in cells expressing wild‐type YAP (n = 2). AML12 cells were serum‐starved overnight and treated with T0901317 (10 µM) for 6 h. (D) RT‐qPCR analysis of LXRα target gene induction in cells expressing 5SA‐YAP (n = 2). Cells were treated as in (C). (E) LXRE reporter activity in wild‐type or 5SA‐YAP cells (n = 4). AML12 cells were transfected with a firefly luciferase reporter plasmid containing a synthetic 3xLXRE promoter and treated with T0901317 (10 µM) for 6 h. Renilla luciferase activity was used for normalization. (F) RT‐qPCR analysis of LXRα target gene induction in cells expressing 5SA/S94A‐YAP (n = 2). Cells were treated as in (C). (G) LXRE reporter activity in 5SA/S94A‐YAP cells (n = 4). Cells were treated as in (e), and the values of wild‐type cells, performed at the same time, were shared. (H) Co‐immunoprecipitation assay of LXRα and RXRα in wild‐type, LATS1/2 KO, and YAP/TAZ KO cells. HEK293 cells of the indicated genotype were transfected with LXRα‐Myc and RXRα‐HA vectors for 24 h (n = 3). Cell lysates were immunoprecipitated with Myc or HA antibodies. YAP phosphorylation was determined by Phos‐tag immunoblotting. Numbers below each band indicate the relative densitometric values normalized to Vinculin. (I) Chromatin immunoprecipitation (ChIP) assay (n = 3). Association of LXRα (top) or RXRα (bottom) to the LXRα‐binding regions on ABCG1, ABCA1, and ABCG5 promoters was analyzed in wild‐type and LATS1/2 KO HEK293 cells. Cells were co‐transfected with LXRα‐Myc and RXRα‐HA for 24 h prior to fixation. For input control, 2% of cross‐linked lysates were used. (J) Immunoblot analysis of primary hepatocytes from wild‐type (WT) mice or Yap/Taz KO or LXRα KO. Numbers below each band indicate the relative densitometric values normalized to Vinculin. (K) A schematic diagram showing the role of YAP/TAZ‐mediated inhibition of LXR. Data are presented as the mean ± s.e.m. p values were determined by an unpaired two‐tailed Student's t‐test.FIGURE 7Yap/Taz ablation prevents cholesterol accumulation in the liver and ameliorates cholesterol‐induced liver fibrosis. (A–L) AAV8‐TBG‐Cre or AAV8‐TBG‐Null control virus was injected into Yap/Tazfl/fl mice to yield hepatocyte‐specific Yap/Taz knockout (Yap/TazHepKO) or wild‐type (WT) mice, respectively. The mice were then fed with a normal diet (ND) or a high‐fat, high‐cholesterol diet (HFHC) for 12 weeks (n = 6). (A) Experimental scheme. (B) Fluorescence images for tdTomato expression in primary hepatocytes. Scale bar, 50 µm. (C) Gross appearance of mouse liver. Scale bar, 5 mm. (D) Immunoblotting for YAP to validate complete gene deletion in mouse liver and quantification of protein levels (n = 2 or 6). (E) Total cholesterol levels in the liver and serum. The relative ratio of liver‐to‐serum cholesterol levels was compared. Liver cholesterol levels were normalized to the tissue weight. (F) Representative images of Filipin staining for cholesterol. Scale bar, 50 µm. (G) Triglyceride levels in the liver and serum. (H) Sirius Red staining of liver sections. Scale bar, 50 µm (left). Sirius Red‐fibrosis collagen area was quantified under polarized light (right). (I) RT‐qPCR analysis of genes associated with cholesterol efflux genes (LXR‐target), fibrosis‐associated genes, and lipid and cholesterol metabolism genes. (J) Immunoblotting of YAP, TAZ, LXRα, RXRα, and fibrogenic proteins in mouse liver (n = 4). (K) Quantification of protein levels shown in J. (L) Immunostaining of human liver sections for ABCG8. Scale bar, 50 µm. Data are presented as the mean ± s.e.m. P values were determined by an unpaired two‐tailed Student's t‐test.FIGURE 8Hepatic LXRα target gene expression inversely correlates with liver stiffness in MASLD patients. (A–E) Individuals with MASLD were subjected to transient elastography (N = 229). Liver biopsies were taken and analyzed for RNA‐sequencing. (A) Study design. Patients were categorized into Soft (<5 kPa, n = 90), Medium (5–8 kPa, n = 88), and Stiff (>8 kPa, n = 51) groups based on liver stiffness. (B) Liver stiffness and fibrosis stage of patients in each group. The dotted line indicates 8 kPa. (C) Relative mRNA levels of LXRα and YAP/TAZ target genes from RNA‐seq in each stiffness group. (D) Relative mRNA levels of LXRα and YAP/TAZ target genes in patients grouped for fibrosis stage (n = 168, 45, 6, and 10). (E) Immunostaining of human liver sections for ABCG8 and active YAP. Scale bar, 100 µm. (F) Single‐cell RNA‐seq analysis of cirrhotic and healthy human livers (n = 5 each). From clusters of single cells by cell lineage, hepatocytes were analyzed for LXRα and YAP/TAZ target gene expression. The data were extracted from GSE136103. (G) A proposed model for the current study. Stiff livers from MASLD patients show elevated cholesterol accumulation, driven by YAP/TAZ‐mediated LXRα repression. In the nucleus, YAP/TAZ disrupts LXRα‐RXRα dimerization. Data are presented as the mean ± s.e.m. p‐values across more than two groups were determined by one‐way ANOVA with Bonferroni's multiple comparisons test. p‐values for individual groups compared to the control were determined by an unpaired Student's t‐test.
Cholesterol · YAP-Signaling Proteins · Liver X Receptors · Adaptor Proteins, Signal Transducing · Transcription Factors · Trans-Activators · Cell Cycle Proteins · YAP1 protein, human · WWTR1 protein, human · Transcriptional Coactivator with PDZ-Binding Motif Proteins
연구비
National Research Foundation of Korea RS-2024-00348340 · National Research Foundation of Korea RS-2025-24534787 · National Research Foundation of Korea 2022M3A9I2017587 · National Research Foundation of Korea 2022R1C1C1003619 · National Research Foundation of Korea 2021R1A2C2005820 · National Research Foundation of Korea 2021M3A9E4021818 · Seoul National University Creative-PioneeringResearchersProgram · Seoul National University 0430-20250028 · Korean Ministry of Education RS-2025-25404154 · National Research Foundation of Korea RS-2021-NR056442 · National Research Foundation of Korea RS-2025-25458964