Biomedical Research Institute, Seoul National University Hospital, Seoul, Republic of Korea.
Department of Internal Medicine, Seoul National University Hospital, Seoul, Republic of Korea.
Department of Internal Medicine, Seoul National University College of Medicine, Seoul, Republic of Korea.
Abstract
The role of cellular senescence in the development of asthma is not well known. We aimed to evaluate the susceptibility of mice with cellular senescence to asthma development and determine whether the mTOR pathway played an important role in this process. Cellular senescence was induced in mice by intranasal instillation of 2% cigarette smoke extract (CSE). Subsequently, a low dose (0.1 μg) of house dust mite (HDM) allergens, which cause no inflammation and airway hyperresponsiveness (AHR) in mice without cellular senescence, was administered intranasally. To evaluate the role of the mTOR pathway in this model, rapamycin (TORC1 inhibitor) was injected intraperitoneally before CSE instillation. CSE significantly increased senescence-associated β-gal activity in lung homogenate and S100A8/9+ p-mTOR+ population in lung cells. Moreover, S100A8/9+ or HMGB1+ populations in airway epithelial cells with p-mTOR activity increased remarkably. Rapamycin attenuated all changes. Subsequent administration of low-dose HDM allergen induced murine asthma characterized by increased AHR, serum HDM-specific immunoglobulin E, and eosinophilic airway inflammation; these asthma characteristics disappeared after rapamycin injection. In vitro experiments showed significant activation of bone marrow-derived cells cocultured with S100A9 or HMGB1 overexpressing MLE-12 cells treated with HDM allergen, compared to those treated with HDM allergen only. CSE increased the levels of senescence markers (S100A8/9 and HMGB1) in airway epithelial cells, making the mice susceptible to asthma development due to low-dose HDM allergens by activating dendritic cells. Because rapamycin significantly attenuated asthma characteristics, the mTOR pathway may be important in this murine model.
Animal modelAsthmaCellular senescenceCigarette smokingHMGB1S100A9SirolimusmTOR protein
Figures
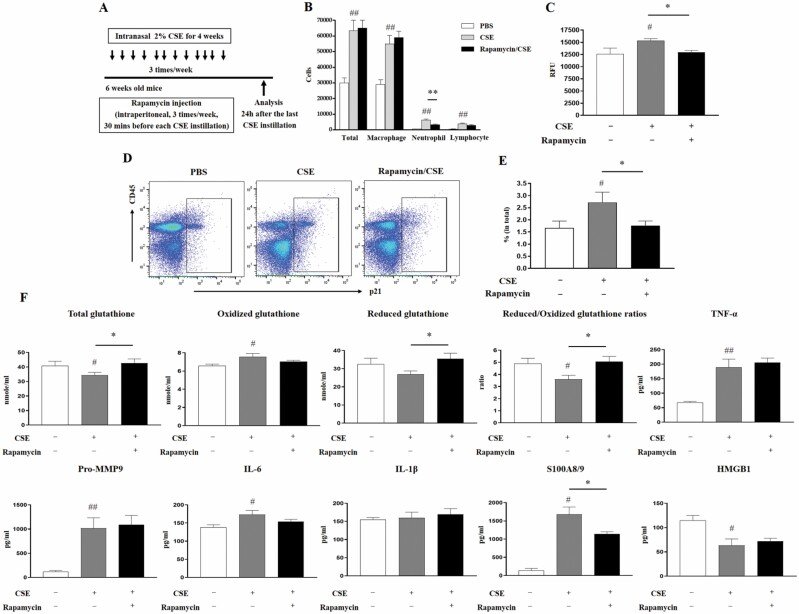
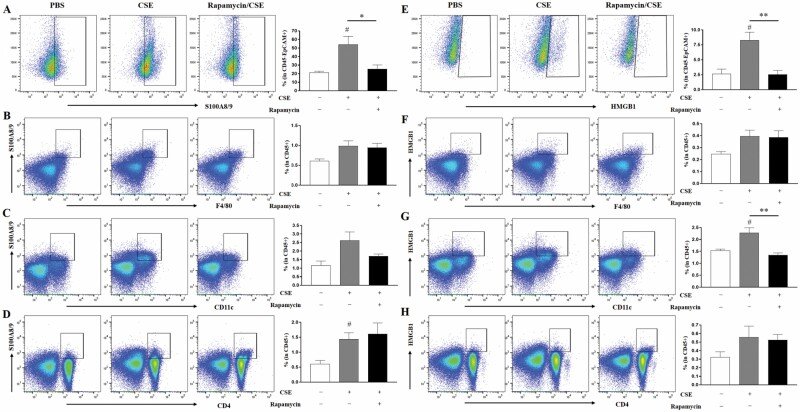
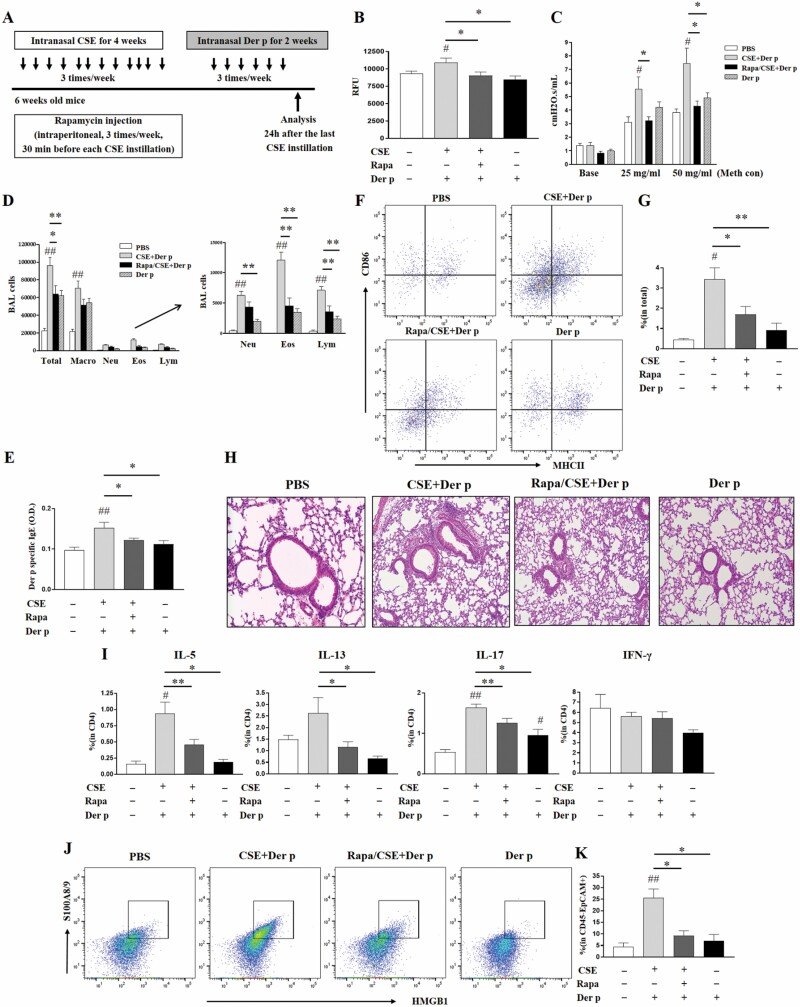
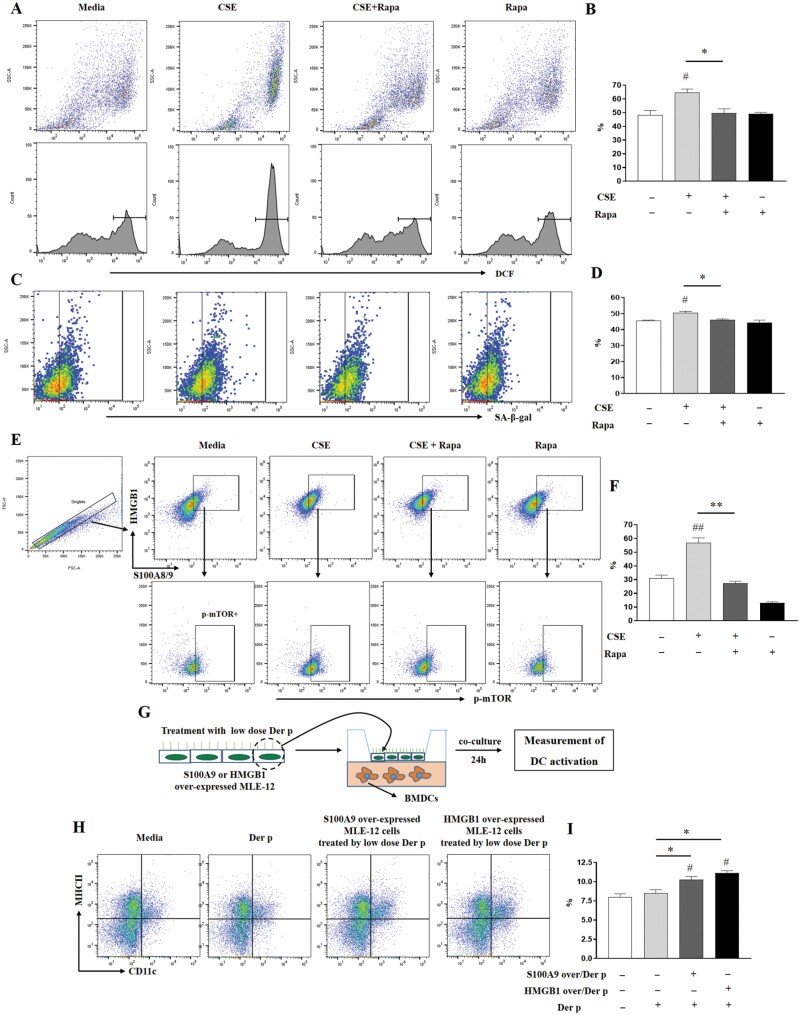
Figure 1.Effect of CSE on SA-β-gal activity and mTOR activation. (A) Experimental protocol (5–6 mice in each CSE group). (B) Inflammatory cells in bronchoalveolar lavage fluid. (C) SA-β-gal activity in lung homogenate. Y axis represents relative fluorescence unit (RFU). (D) Plot of S100A8/9+ p-mTOR+ population in lung cells. (E) The frequency of S100A8/9+ p-mTOR+ population in lung cells. Y axis represents the frequency of reading for total cells from lung cells. #p < .05, ##p < .01 compared to the control (PBS) group. PBS = phosphate-buffered saline; SA-β-gal = senescence-associated beta-galactosidase; CSE = cigarette smoke extract.Figure 2.Effects of rapamycin on the CSE-induced changes of inflammatory and senescence-associated markers in lung and glutathione in serum. (A) Experimental protocol (5–6 mice in each group). (B) Inflammatory cells in bronchoalveolar lavage fluid. (C) SA-β-gal activity in lung homogenate. Y axis represents relative fluorescence unit (RFU). (D) A plot of p21+ population in lung cells. (E) The frequency of p21+ population in lung cells. (F) Total glutathione, oxidized glutathione and reduced glutathione levels, and reduced/oxidized glutathione ratios in serum were measured, and the detection time was 2 minutes. TNF-α, Pro-MMP9, IL-6, IL-1β, S100A8/9, and HMGB1 levels in bronchoalveolar lavage fluid were measured. #p < .05, ##p < .01 compared to control (PBS) group; *p < .05, **p < .01 between 2 groups. PBS = phosphate-buffered saline; SA-β-gal = senescence-associated beta-galactosidase; CSE = cigarette smoke extract.Figure 3.Effects of rapamycin on the CSE-induced changes of S100A8/9+ or HMGB1+ populations in various lung cells. (A) Gating plot and the frequency of S100A8/9+ population in CD45− EpCAM+ cells. (B) Gating plot and the frequency of S100A8/9+ F4/80+ population in CD45+ cells. (C) Gating plot and the frequency of S100A8/9+ CD11c+ population in CD45+ cells. (D) Gating plot and the frequency of S100A8/9+ population in CD4+ cells. (E) Gating plot and the frequency of HMGB1+ population in CD45− EpCAM+ cells. (F) Gating plot and the frequency of HMGB1+ F4/80+ population in CD45+ cells. (G) Gating plot and the frequency of HMGB1+ CD11c+ population in CD45+ cells. (H) Gating plot and frequency of HMGB1+ population in CD4+ cells. #p < .05 compared to control (PBS) group; *p < .05, **p < .01 between 2 groups. PBS = phosphate-buffered saline; CSE = cigarette smoke extract.Figure 4.Murine asthma model with CSE-induced cellular senescence and effects of rapamycin on this model. (A) Experimental protocol (4–5 mice in each group). (B) SA-β-gal activity in lung homogenate. Y axis represents relative fluorescence unit (RFU). (C) Airway hyperresponsiveness. Y axis represents cmH2O.s/mL. (D) Inflammatory cells in bronchoalveolar lavage fluid. (E) Serum Der p-specific IgE. Y axis represents OD (optimal density). (F) Gating plot of MHCII+ CD86+ population in CD11c+ cells from lung-draining lymph node. (G) The frequency of MHCII+ CD86+ population with CD11c+ in total cells from lung-draining lymph node. (H) Lung tissue (H&E stain, ×200). (I) The frequencies of IL-5+, IL-13+, IL-17+, and IFN-γ+ populations in CD4+ cells. (J) Gating plot of S100A8/9+ HMGB1+ population in CD45− Epcam+ cells. (K) The frequency of S100A8/9+ HMGB1+ population in CD45− Epcam+ cells. #p < .05, ##p < .01 compared to control (PBS) group; *p < .05, **p < .01 between 2 groups. Der p = Dermatophagoides pteronyssinus; Meth con = methacholine concentration; Macro = macrophage; Neu = neutrophil; Eos = eosinophil; Lym = lymphocyte; Rapa = rapamycin; CSE = cigarette smoke extract.Figure 5.Effects of rapamycin on CSE-stimulated MLE-12 cells and effects of S100A9 or HMGB1 overexpressing MLE-12 cells treated by low-dose Dermatophagoides pteronyssinus allergen on dendritic cell activation. (A) Plot (upper) and histogram (lower) of DCF+ population in CSE-stimulated MLE-12 cells (with or without rapamycin). (B) The frequency of DCF+ population. Y axis of graph represents % of DCF+ cells. (C) Gating plot of SA-β-gal+ population in total cells from CSE-stimulated MLE-12 cells (with or without rapamycin). (D) The frequency of SA-β-gal+ population. (E) Gating plot of p-mTOR+ population in S100A8/9+ HMGB1+ cells in singlets from CSE-stimulated MLE-12 cells (with or without rapamycin). (F) The frequency of p-mTOR+ population in S100A8/9+HMGB1+ cells. (G) Experimental procedure. (H) Gating plot of MHCII+ CD11c+ population in BMDC after coculture with S100A9 or HMGB1 overexpressing MLE-12 cells. (I) The frequency of MHCII+ CD11c+ cells in BMDCs after coculture with S100A9 or HMGB1 overexpressing MLE-12 cells. #p < .05, ##p < .01 compared to media; *p < .05, **p < .01 between 2 groups. DCF = dichlorofluorescein; CSE = cigarette smoke extract.
그림 출처: PubMed Central 공개 논문 (PMC8893251)
그 밖의 정보
출판 형태
Journal Article, Research Support, Non-U.S. Gov't
저널
The journals of gerontology. Series A, Biological sciences and medical sciences · eISSN 1758-535X