Cancer Research Institute, Seoul National University College of Medicine, Seoul, Korea.
Department of Internal Medicine, Seoul National University Bundang Hospital, Seongnam, Korea.
Department of Internal Medicine, Seoul National University Hospital, Seoul, Korea.
Abstract
Currently, there is no validated therapeutic target for biliary tract cancer (BTC). This study aimed to investigate the pre-clinical and clinical implication of HER2 as a therapeutic target in BTC. We established two novel HER2-amplified BTC cell lines, SNU-2670 and SNU-2773, from gallbladder cancer patients. SNU-2670 and SNU-2773 cells were sensitive to trastuzumab, dacomitinib, and afatinib compared with nine HER2-negative BTC cell lines. Dacomitinib and afatinib led to G1 cell cycle arrest in SNU-2773 cells and apoptosis in SNU-2670 cells. Furthermore, dacomitinib, afatinib, and trastuzumab showed synergistic cytotoxicity when combined with some cytotoxic drugs including gemcitabine, cisplatin, paclitaxel, and 5-fluorouracil. In a SNU-2670 mouse xenograft model, trastuzumab demonstrated a good anti-tumor effect as a monotherapy and in combination with gemcitabine increasing apoptosis. In our clinical data, 13.0% of patients with advanced BTC were defined as HER2-positive. Of these, three patients completed HER2-targeted chemotherapy. Two of them demonstrated a partial response, and the other one showed stable disease for 18 weeks. In summary, these pre-clinical and clinical data suggest that HER2 could be a therapeutic target, and that a HER2-targeting strategy should be developed further in patients with HER2-positive advanced BTC.
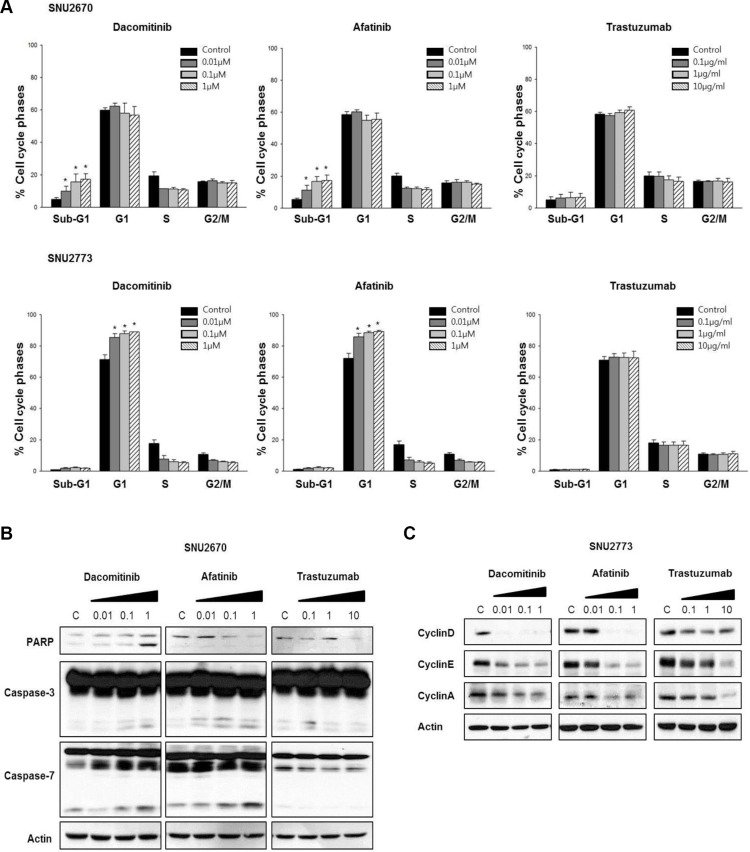
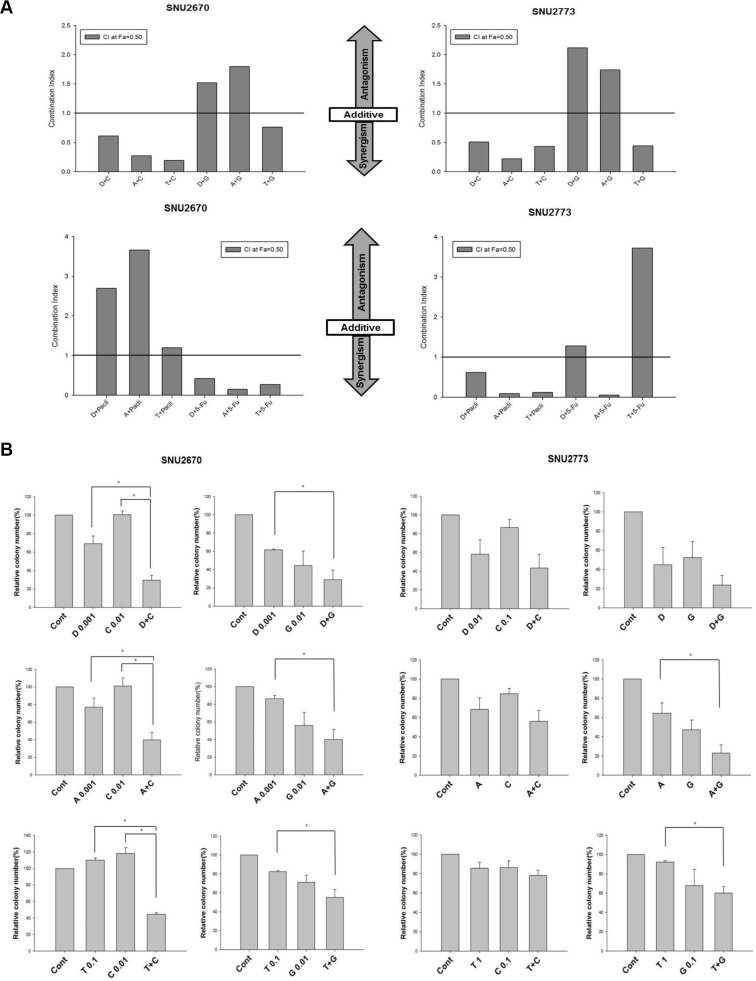
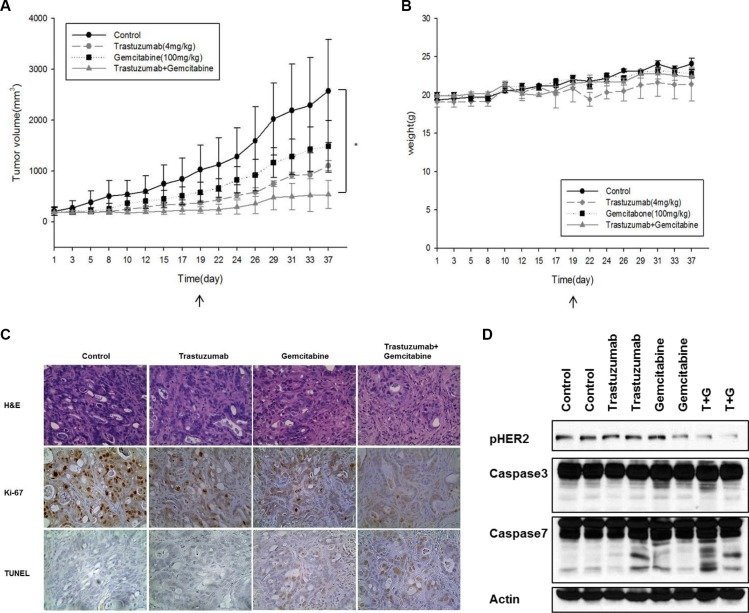
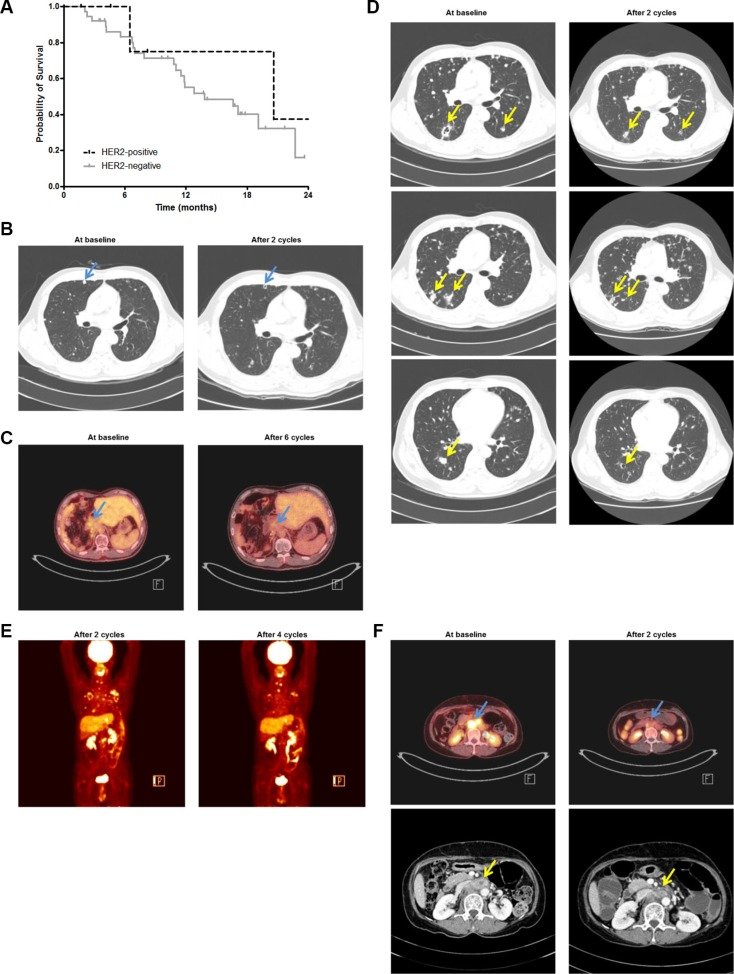
Figure 1 HER2-targeted treatment in HER2-amplified BTC cells (A) Both SNU-2670 and SNU-2773 cell lines showed strong HER2 expression compared with the other cell lines. (B) Using MTT assays, anti-proliferative effects of dacomitinib, afatinib, gemcitabine, and cisplatin were evaluated in SNU-2670 and SNU-2773 cells. Anti-proliferative effects of trastuzumab were evaluated in 10 human BTC cell lines: SNU-245, SNU-308, SNU-478, SNU-869, SNU-1079, SNU-1196, SNU-2670, SNU-2773, HuCCT1, and TFK-1. (C) Colony formation assays demonstrated the cytotoxic effect of dacomitinib, afatinib, and trastuzumab. (D) HER2-targeted agents abrogated downstream signaling pathways of HER2. The cells were treated with dacomitinib (0.01, 0.1, and 1 μM), afatinib (0.01, 0.1, and 1 μM), and trastuzumab (0.1, 1, and 10 μg/mL) for 48 h, and then immunoblotted with the indicated antibodies.Figure 2 Cell cycle arrest and apoptosis after HER2-targeted therapy (A) Cell cycle analysis was performed in SNU-2670 and SNU-2773 cells after dacomitinib, afatinib, and trastuzumab treatment. *P < 0.05. (B) Effects of dacomitinib (0, 0.01, 0.1, and 1 μM), afatinib (0, 0.01, 0.1, and 1 μM), and trastuzumab (0, 0.1, 1, and 10 μg/mL) on apoptosis pathways were evaluated in SNU-2670 cells. (C) Effects of dacomitinib (0, 0.01, 0.1, and 1 μM), afatinib (0, 0.01, 0.1, and 1 μM), and trastuzumab (0, 0.1, 1, and 10 μg/mL) on G1 cell cycle arrest were evaluated in SNU-2773 cells.Figure 3 Synergistic cytotoxic effects of HER2-targeted agents and cytotoxic agents (A) Anti-proliferative effects of combination chemotherapy of HER2-targeted agents including dacomitinib (‘D’), afatinib (‘A’), or trastuzumab (‘T’) and a cytotoxic agent including cisplatin (‘C’), gemcitabine (‘G’), paclitaxel (‘P’), or 5-FU (‘F’) were evaluated in SNU-2670 and SNU-2773 cells using MTT assays. (B) Colony forming assays were performed to demonstrate the combined effect of a HER2-targeted agent and a cytotoxic agent. The concentration of each drug is indicated in the graph. The unit of concentration for each drug is μM for dacomitinib, afatinib, cisplatin, and gemcitabine and μg/mL for trastuzumab. The concentration of each agent in combination treatment was the same as that in single treatment. Anti-proliferative effects of combination chemotherapy were statistically compared with those of single agent chemotherapy to evaluate the efficacy of combination therapy. *P < 0.05. (C) Western blot analysis indicated that combination treatment more potently abrogated the downstream signaling pathways of HER2.Figure 4 Synergistic anti-tumor effects of trastuzumab combined with gemcitabine in a mouse xenograft model (A) In vivo efficacy of trastuzumab alone, gemcitabine alone, or a combination of the two drugs was evaluated using a SNU-2670 xenograft model. *P < 0.05. (B) To evaluate the effect of chemotherapy on body weight, the body weight of mice was measured every other day. (C) At 37 days the tumors were harvested and analyzed using IHC. Ki-67 and TUNEL assays were performed to evaluate cell proliferation and apoptosis, respectively. (D) Western blot assays were performed using the excised tumors from the xenograft model to elucidate the effect of trastuzumab and/or gemcitabine on HER2 phosphorylation and apoptosis molecules.Figure 5 Clinical implications of HER2-targeted therapy in patients with advanced BTC (A) In our patient cohort, patients with HER2-positive disease tended to live longer than those with HER2-negative disease (median OS, 20.6 months vs. 13.8 months; P = 0.430). Two patients with HER2 IHC 2+ and FISH unknown were excluded from the survival analysis. (B) In Patient B, after two cycles of third-line trastuzumab/paclitaxel chemotherapy, CT scanning revealed a cystic change in the metastatic lung nodules (arrows). (C) After six cycles, 18F-fluorodeoxyglucose (18F-FDG) positron emission tomography scans revealed decreased maximal standardized uptake values from 3.4 to 2.2 (arrows). (D) After progression, the patient was enrolled in a phase I clinical trial of a novel anti-HER2-monoclonal antibody monotherapy as a fourth-line chemotherapy. After two cycles, CT scanning demonstrated a cystic change in the metastatic lung nodules (arrows). (E) After four cycles, 18F-FDG PET scanning revealed further decreased metabolism in metastatic tumors in the lungs, T1 spine, left adrenal gland, and lymph nodes. (F) In Patient C, after two cycles of third-line chemotherapy of trastuzumab combined with capecitabine and cisplatin, 18F-FDG PET scanning demonstrated markedly decreased metabolism in the retroperitoneal lymph node metastasis (arrows) with maximal SUV decrease from 13.98 to 7.3. In addition, CT scanning indicated that the size of the metastatic retroperitoneal lymph nodes (arrows) decreased from 36.2 mm × 21.7 mm to 29.1 mm × 13.9 mm.