Cancer Research Institute, Seoul National University, Seoul, South Korea.
Abstract
BACKGROUND Identification of predictive biomarkers is essential for the successful development of targeted therapy. Insulin-like growth factor 1 receptor (IGF1R) has been examined as a potential therapeutic target for various cancers. However, recent clinical trials showed that anti-IGF1R antibody and chemotherapy are not effective for treating lung cancer.
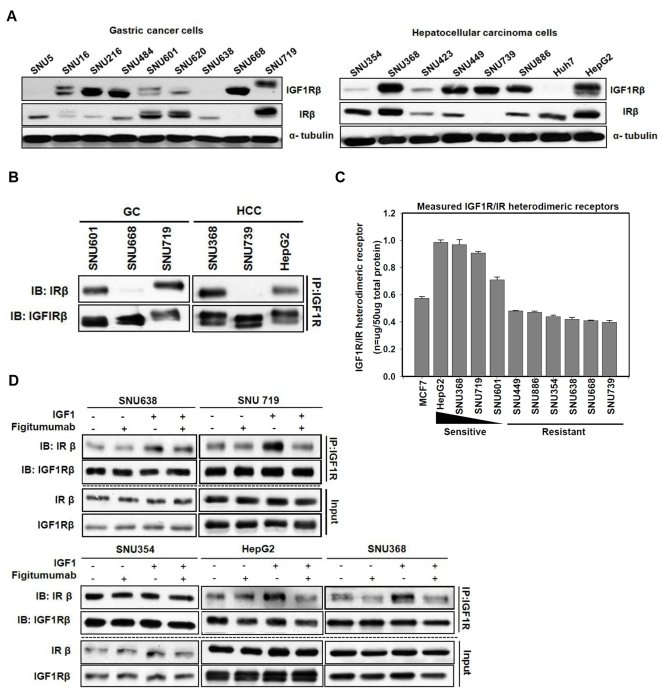
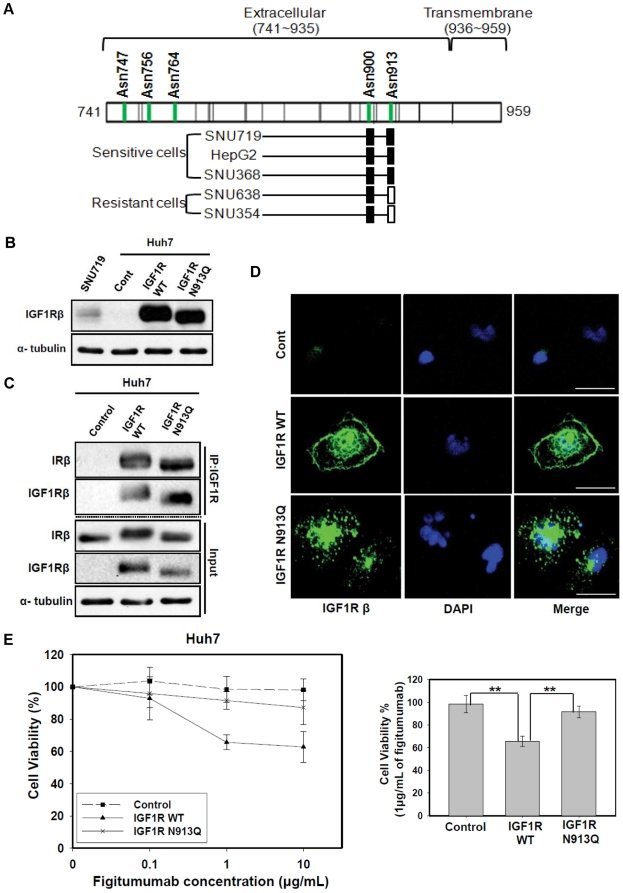
METHODOLOGY/PRINCIPAL FINDINGS In order to define biomarkers for predicting successful IGF1R targeted therapy, we evaluated the anti-proliferation effect of figitumumab (CP-751,871), a humanized anti-IGF1R antibody, against nine gastric and eight hepatocellular cancer cell lines. Out of 17 cancer cell lines, figitumumab effectively inhibited the growth of three cell lines (SNU719, HepG2, and SNU368), decreased p-AKT and p-STAT3 levels, and induced G 1 arrest in a dose-dependent manner. Interestingly, these cells showed co-overexpression and altered mobility of the IGF1R and insulin receptor (IR). Immunoprecipitaion (IP) assays and ELISA confirmed the presence of IGF1R/IR heterodimeric receptors in figitumumab-sensitive cells. Treatment with figitumumab led to the dissociation of IGF1-dependent heterodimeric receptors and inhibited tumor growth with decreased levels of heterodimeric receptors in a mouse xenograft model. We next found that both IGF1R and IR were N-linked glyosylated in figitumumab-sensitive cells. In particular, mass spectrometry showed that IGF1R had N-linked glycans at N913 in three figitumumab-sensitive cell lines. We observed that an absence of N-linked glycosylation at N913 led to a lack of membranous localization of IGF1R and figitumumab insensitivity.
CONCLUSION AND SIGNIFICANCE The data suggest that the level of N-linked glycosylated IGF1R/IR heterodimeric receptor is highly associated with sensitivity to anti-IGF1R antibody in cancer cells.
Figures
Figure 1 Anti-proliferative effect of figitumumab. A) Analysis of the anti-proliferative effect of figitumumab on gastric and hepatocellular carcinoma cells. Two groups of cancer cells, including nine gastric cancer cell lines and eight hepatocellular carcinoma cell lines, were treated with increasing concentrations of figitumumab (0, 0.1, 1, and 10 µg/mL) for 120 h to inhibit the growth of the control cells by 30%. Cell proliferation was assessed by an MTT assay. Six replicate wells were used for each analysis, and at least three independent experiments were conducted. Data from replicate wells are presented as the mean of the remaining cells. Bars = ±SE. B) Effect of figitumumab on the IGF1R signaling pathway. Immunoblotting analysis was performed to observe the dose-response effect of figitumumab (0.1–10 µg/mL) on IGF1R signaling. SNU638, SNU719, SNU354, HepG2, and SNU368 cells were exposed to increasing concentrations of figitumumab for 72 h. The levels of proteins associated with the IGF1R pathway and their activated forms were analyzed. Differences relative to the control are shown. In each panel, representative blots from three independent experiments are shown. C) Effect of figitumumab on the cell cycle distribution. Figitumumab-sensitive cells (SNU719, HepG2, and SNU368) were treated with increasing concentrations of the drug [0 µg/mL (black solid bar), 0.1 µg/mL (gray solid bar), 1 µg/mL (white bar), and 10 µg/mL (dark gray hatched bar)] for 48 h and then stained with propidium iodide, and analyzed by flow cytometry. The percentage of cells in the G0/G1, S, and G2/M phases are shown. Columns represent the mean of three independent experiments; Bars = ±SE. *P-values <0.05, **P-values <0.01. D) Effect of figitumumab on tumor growth in mice bearing HepG2 xenografts. HepG2 cells (1×10⁷) were injected into the right flank of nude mice (n = 5). Treatment with figitumumab (125 µg/mL [6.3 mg/kg body weight], once per week for 3 wk) was initiated once the tumor volume had reached 200 mm3. No significant body weight loss was observed during the course of the study. The tumors were measured with calipers at regular intervals. Solid circles = treatment with vehicle control alone (control), Open triangles = treatment with figitumumab. Differences between the two groups (tumor sizes of the control mice and those of mice treated with figitumumab) were compared from day 17 until the end of the treatment period (day 21) using a two-sided Student’s t test. *P-values <0.05; **P-values <0.01 versus control.Figure 2 Analysis of IGF1R, IR, and IGF1R/IR HR levels in cancer cells sensitive to anti-IGF1R antibody. A) Immunoblot analysis of total IGF1Rβ and IRβ protein levels. Two types of gastric and hepatocellular carcinoma cells were harvested 24 h after plating and immunoblotting with anti-IGF1Rβ antibody, anti-IRβ antibody, and anti-α tubulin antibody was performed. For both types of cells, representative blots from three independent experiments are shown. B) Analysis of the presence of IGF1R/IR heterodimeric receptor (HRs) using immunoprecipitation. Total cellular proteins (1 mg) from cells were used for immunoprecipitation with anti-IGF1R antibody, separated by SDS-PAGE at constant voltage (80 V), and Western blotted with an anti-IRβ antibody. The blot was then stripped and reprobed with anti-IGF1Rβ antibody C) Quantitative analysis of IGF1R homodimer, IR homodimer, and IGF1R/IR heterodimer levels using an ELISA. Lysis buffer (100 µL) containing equal amount of proteins (50 µg/well) from 11 cancer cell lines including MCF7 cells (positive control) were plated on anti-IGF1R antibody-coated wells and detected with an anti-IR detection antibody. Anti-IR antibody-coated wells, IR protein standards, and the anti-IR detection antibody were used as standards in the heterodimeric receptor ELISA. Absorbance was measured at 450 nm. Values are expressed as the mean±SEM nanograms of receptor protein per 50 µg total protein. Cell lines are listed according to their sensitivity to figitumumab. Bars = ±SE. D) Effect of figitumumab on IGF1- mediated IGF1R/IR HRs. Cells were serum-starved for 24 h and then treated with figitumumab, IGF1, or left untreated. SNU719 cells were incubated with figitumumab (10 µg/mL) for 1 h at 37°C followed by stimulation with IGF1 (100 ng/mL) for 30 min. Immunoprecipitation was performed with an anti-IGF1R antibody and Western blotted. Input = total cell lysate without IP.Figure 3 Effect of selective IR overexpression on HR levels and the anti-proliferative effect of figitumumab in IR-transfected cells. A) Effect of IR transfection on IGF1R/IR HR levels in IR-negative cell lines. Cells were transfected with the pcDNA3.1(-) expression vector containing wild-type IR cDNA. An equal amount of lysates from cells transfected with either the empty vector or pcDNA3.1(-) containing IR cDNA was subjected to immunoprecipitation with an anti-IGF1R antibody followed by Western blot analyses of IRβ and IGF1Rβ. B) Effect of IR-transfection on figitumumab sensitivity. Transfected cells were plated onto 96-well plates, treated with figitumumab for 5 d, and subjected to MTT assays. Solid triangle symbol with dashed lines = empty vector (pcDNA3.1-), Solid circle symbols with lines = pcDNA3.1(-) IR. Bar = ±SE. Mean values were derived from six replicates. Experiments were repeated in triplicate.Figure 4 Analysis of NLG of IGF1Rβ and IRβ in figitumumab-sensitive cell lines. A) Immunoblot analysis of different IGF1Rβ migration pattern on SDS-PAGE. Electrophoretic mobility patterns of IGF1Rβ were analyzed in parallel by Western bloting. Experiments were repeated at least three times with similar results. B) Analysis of N-glycosylated IRβ and IGF1Rβ in sensitive cell lines by enzymic deglycosylation with PNGage F. All samples were incubated at 37°C for 12 h with PNGage F. IGF1Rβ and IRβ proteins were analyzed in parallel by Western blotting. The blots shown are representatives of three independent experiments.Figure 5 Identification of a specific N-linked glycosylation site (N913) of IGF1R in sensitive cell lines and its functional importance in the response to figitumumab. A) Identification of the NLG site occupancy of IGF1Rβ subunits. IGF1Rβ subunits containing N-linked glycosylation sites (Asn747, Asn756, Asn764, Asn900, and Asn913) were isolated from both drug sensitive (SNU719, HepG2 and SNU368) and resistance (SNU638 and SNU354) cells and identified by tandem MS by an increase of 1.0 Da from the corresponding mass of Asn as a result of conversion from N-linked glycosylated Asn to Asp. All the NLG at Asn900 in both sensitive and resistance cells were determined to be occupied with N-glycosylation (filled rectangle). NLG at Asn913 of the sensitive cell lines (HepG2, SNU719, and SNU368) were determined to be occupied with N-glycosylation (filled rectangle), whereas N-glycosites at Asn913 of the resistance cell lines (SNU638 and SNU354) were found to be unoccupied with N-glycosylation. (open rectangle). B) Effect of the N913Q site mutation on electrophoretic mobility patterns of IGF1Rβ. Huh7 cells (an IGF1R-negative cell line) were transfected with the empty pcDNA3.1(-) expression vector(Control), pcDNA3.1(-) containing wild-type IGF1R cDNA (IGF1R WT), or pcDNA3.1(-) with IGF1R mutation type cDNA (IGF1R N913Q). An equal amount of the cell lysate from the transfected cells was then subjected to Western blot analysis for IGF1Rβ. C) Effect of N913Q site mutation on the formation of IGF1R/IR heterodimeric receptors. An equal amount of the cell lysate from transfected cells was then subjected to immunoprecipitation (IP) with anti-IGF1R antibody followed by Western blot analysis for IRβ and IGF1Rβ. Input = total cell lysate without IP. D) Effect of N913Q site mutation on IGF1R localization. An immunofluoresence assay was conducted to observe the localization of IGF1R. IGF1R reactivity was visualized by confocal laser scanning microscopy (Scale bar: 30 µm). Representative images are shown. Green: IGF1R, Blue: nuclei. E) Effect of N913Q site mutation on figitumumab sensitivity. Huh7 cells transfected with empty pcDNA3.1(-) vector, vector containing wild-type IGF1R cDNA, or vector containing IGF1R (N913Q) mutation type cDNA were plated in 96-well plates and treated with increasing concentrations of figitumumab for 120 h (left). Cell viability percentages with 1 µg/mL figitumumab (right). Six replicate wells were included in each analysis, and at least three independent experiments were conducted. Data from replicate wells are presented as the mean of remaining cells. * P-values <0.05; ** P-values <0.01.
그림 출처: PubMed Central 공개 논문 (PMC3306383)
Conflict of interest statement
Competing Interests:The authors have declared that no competing interests exist.