
Sci Rep. 2017;7:42966.
Prediction of Mortality and Postoperative Complications using the Hip-Multidimensional Frailty Score in Elderly Patients with Hip Fracture.
제1저자 최정연 · 교신저자 김광일
소속 (4)
- Department of Internal Medicine, Seoul National University College of Medicine, Seoul, Republic of Korea.
- Department of Orthopedic Surgery, Seoul National University College of Medicine, Seoul, Republic of Korea.
- Department of Internal Medicine, Seoul National University Bundang Hospital, Seongnam, Republic of Korea.
- Department of Orthopedic surgery, Seoul National University Bundang Hospital, Seongnam, Republic of Korea.
Abstract
High mortality and dependent living after hip fracture pose a significant public health concern. Retrospective study was conducted with 481 hip fracture patients (≥65 years of age) undergoing surgery from March 2009 to May 2014. The Hip-MFS was calculated by Comprehensive Geriatric Assessment (CGA). The primary outcome was the 6-month all-cause mortality rate. The secondary outcomes were 1-year all-cause mortality, postoperative complications and prolonged hospital stay, and institutionalization. Thirty-five patients (7.3%) died within 6 months after surgery (median [interquartile range], 2.9 [1.4-3.9] months). The fully adjusted hazard ratio per 1 point increase in Hip-MFS was 1.458 (95% confidence interval [CI]: 1.210-1.758) for 6-months mortality and odds ratio were 1.239 (95% CI: 1.115-1.377), 1.156 (95% CI: 1.031-1.296) for postoperative complications and prolonged total hospital stay, respectively. High-risk patients (Hip-MFS > 8) showed higher risk of 6-month mortality (hazard ratio: 3.545, 95% CI: 1.466-8.572) than low-risk patients after adjustment. Hip-MFS successfully predict 6-month mortality, postoperative complications and prolonged hospital stay in elderly hip fracture patients after surgery. Hip-MFS more precisely predict 6-month mortality than age or existing tools (P values of comparison of ROC curve: 0.002, 0.004, and 0.044 for the ASA classification, age and NHFS, respectively).
Figures

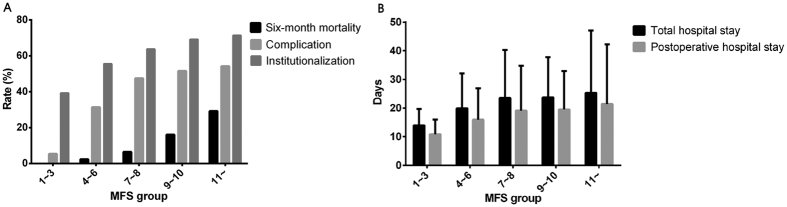
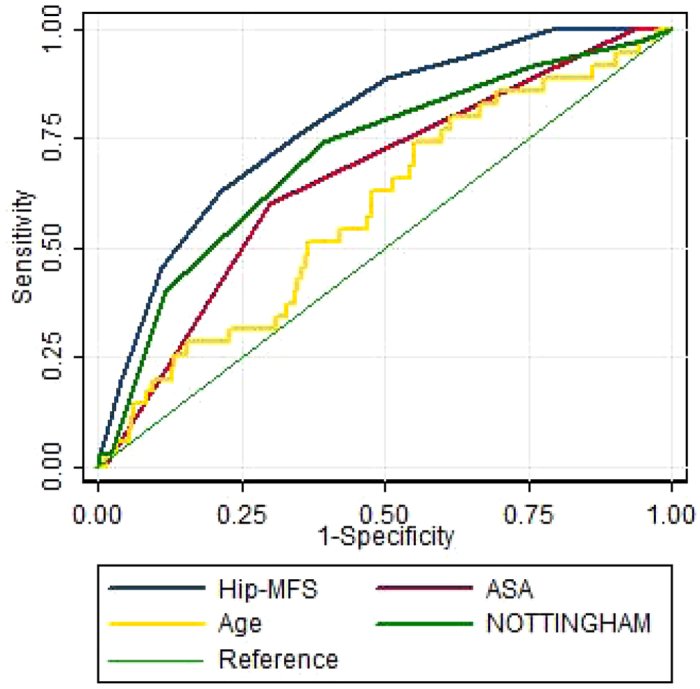
그림 출처: PubMed Central 공개 논문 (PMC5324046)
Conflict of interest statement
The authors declare no competing financial interests.
그 밖의 정보
- 출판 형태
- Journal Article
- 저널
- Scientific reports · eISSN 2045-2322
- 전자 출판
- 2017-02-24
- MeSH
- Aged · Aged, 80 and over · Area Under Curve · Female · Hip Fractures / mortality / pathology / surgery · Humans · Kaplan-Meier Estimate · Length of Stay · Logistic Models · Male · Odds Ratio · Postoperative Complications* · Proportional Hazards Models · ROC Curve · Retrospective Studies · Risk Factors
- 참고문헌
- 34편