Cardiovascular Center, Seoul National University Hospital;; Department of Internal Medicine, Seoul National University College of Medicine.
Department of Nuclear Medicine, Seoul National University Hospital and Seoul National University College of Medicine.
Department of Internal Medicine, Gangnam Severance Hospital, Yonsei University College of Medicine, Seoul, South Korea.
Cardiovascular Center, Seoul National University Hospital.
Abstract
The diagnosis of myocarditis traditionally relies on invasive endomyocardial biopsy but none of the imaging studies so far are specific for infiltration of the inflammatory cells itself. We synthesized 68Ga-2-(p-isothiocyanatobenzyl)-1,4,7-triazacyclononane-1,4,7-triacetic acid (NOTA) mannosylated human serum albumin (MSA) by conjugating human serum albumin with mannose, followed by conjugation with NOTA and labeling it with 68Ga. The efficacy of 68Ga-NOTA-MSA positron emission tomography (PET) for imaging myocardial inflammation was tested in a rat myocarditis model. A significant number of mannose receptor-positive inflammatory cells infiltrated the myocardium in both human and rat myocarditis tissue. 68Ga-NOTA-MSA uptake was upregulated in organs of macrophage accumulation, such as liver, spleen, bone marrow and myocardium (0.32 (0.31~0.33) for normal versus 1.02 (0.86~1.06) for myocarditis (median (range), SUV); n=4~6 per group, p-value=0.01). 68Ga-NOTA-MSA uptake in the left ventricle was upregulated in myocarditis compared with normal rats (2.29 (1.42~3.40) for normal versus 4.18 (3.43~6.15) for myocarditis (median (range), average standard uptake value ratio against paraspinal muscle); n=6 per group, p-value<0.01), which was downregulated in rats with cyclosporine-A treated myocarditis (3.69 (2.59~3.86) for myocarditis versus 2.28 (1.76~2.60) for cyclosporine-A treated myocarditis; n=6 per group, p-value<0.01). The specificity of the tracer was verified by administration of excess non-labeled MSA. 68Ga-NOTA-MSA uptake was significantly enhanced earlier in the evolution of myocarditis before any signs of inflammation could be seen on echocardiography. These results demonstrate the potential utility of visualizing infiltration of mannose receptor-positive macrophages with 68Ga-NOTA-MSA PET in the early diagnosis of as well as in the monitoring of treatment response of myocarditis.
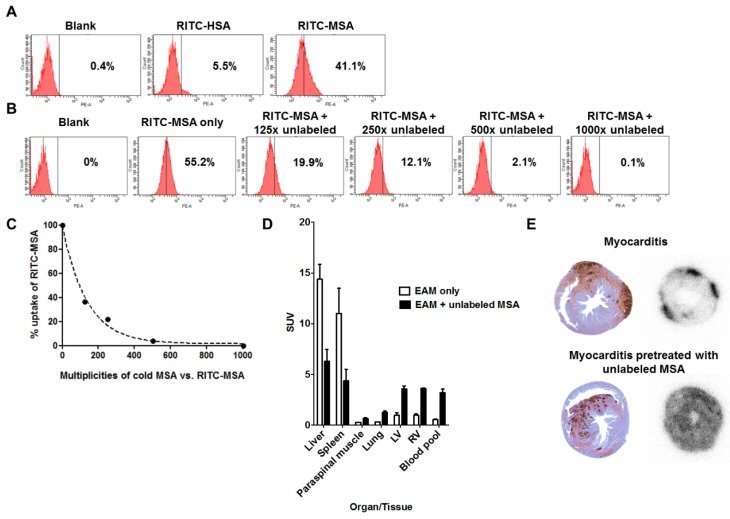
Figure 1Distribution pattern of 68Ga-NOTA-MSA according to time in various organs or tissues. LV, left ventricle; RV, right ventricle; SUV, standard uptake value.Figure 2Infiltration of mannose receptor-positive macrophages in myocarditis.(A) Inflammatory cells infiltrated the myocardium significantly in human myocarditis sample (left panel) as compared to normal human myocardium in heart transplantation recipients (right panel). H&E staining. (B) Adjacent section of samples in Figure 2A identified a significant proportion of the inflammatory cells to be positive for mannose receptor (brown color) in human myocarditis (left panel) as compared to normal human myocardium (right panel). Representative mannose receptor immunostaining images. n=3~4 per group. (C) Inflammatory cells significantly infiltrated the myocardium in the rat myocarditis sample (left panel) as compared to minimal in the normal rat myocardium (right panel). Representative ED-1 immunostaining images. (D) RITC-MSA binds to mannose receptor-positive cells in rat myocarditis, which in turn are ED-1 positive. Red, MSA; green, mannose receptor (MR); white, ED-1; blue, DAPI.Figure 3Uptake of 68Ga-NOTA-MSA in the myocardium.Post-mortem biodistribution of 68Ga-NOTA-MSA in the myocardium of normal versus myocarditis rats, 1 hour post-injection of the tracer. Median values of each groups are shown as horizontal lines. SUV, standard uptake value.Figure 468Ga-NOTA-MSA PET imaging for the diagnosis of myocardial inflammation in myocarditis rats.(A and B) Representative 68Ga-NOTA-MSA images and the corresponding ED-1 staining results for inflammatory cells (brown color) in normal (A) versus myocarditis (B) rats. Higher 68Ga-NOTA-MSA was noted in the myocarditis rats compared with the normal rats, which was corroborated by the massive infiltration of inflammatory cells in the immunohistochemistry. (C) The 68Ga-NOTA-MSA uptake pattern in the myocardium by autoradiography colocalizes with the pattern of inflammatory cell infiltration by ED-1 immunostaining (brown color) in rat myocarditis. (D) Significantly thicker left ventricle (LV) wall in the myocarditis rats compared with the normal rats by M-mode echocardiography. (E and F) Significantly higher average 68Ga-NOTA-MSA uptake at the LV (E) and the right ventricle (RV) (F) in the myocarditis rats compared with the normal rats. The median value of each groups are shown as horizontal lines in (D), (E) and (F). SUV(R), standardized uptake value (ratio).Figure 5Specificity of 68Ga-NOTA-MSA uptake in myocarditis.(A) Mannosylation is needed for uptake of the tracer in RAW 264.7 cell line. (B and C) The degree of RITC-MSA uptake is decreased by pretreatment of cold, unlabeled MSA in a dose-dependent manner. (D) Compared with the myocarditis only rats, the 68Ga radiotracer signals in myocarditis rats pretreated with unlabeled MSA is decreased in the liver and the spleen, whereas the signal is significantly increased in other organs/tissues including the myocardium and the blood cavity. n=3 per group. SUV, mean standardized uptake value. (E) Autoradiography of the rat hearts demonstrate focally increased 68Ga-NOTA-MSA uptake in the myocarditis rats (upper right panel), whereas the signal was diffusely increased in general in the myocarditis rats pretreated with unlabeled MSA (lower right panel). However, the degree of myocardial inflammation is similar between the two representative rats (upper and lower left panels). EAM, experimental autoimmune myocarditis.Figure 668Ga-NOTA-MSA PET imaging for the follow-up of treatment efficacy in myocarditis rats.(A and B) Representative 68Ga-NOTA-MSA PET images and the corresponding ED-1 staining results for inflammatory cells (brown color) in the non-treated myocarditis rats (A) versus the myocarditis rats treated with cyclosporine-A (B). Higher 68Ga-NOTA-MSA uptake was noted in the non-treated myocarditis rats compared with the myocarditis rats treated with cyclosporine-A, which was supported by the infiltration of inflammatory cells in the immunohistochemistry. (C) Significant regression of the left ventricle (LV) hypertrophy/edema was noted in the myocarditis rats treated with cyclosporine-A compared with the non-treated myocarditis rats by M-mode echocardiography. (D and E) Significantly lower average 68Ga-NOTA-MSA uptake at the LV (D) and the right ventricle (RV) (E) in the myocarditis rats treated with cyclosporine-A compared with the non-treated myocarditis rats. The median value of each groups are shown as horizontal lines in (C), (D) and (E). (F) The uptake of 68Ga-NOTA-MSA decreases with the duration of cyclosporine-A treatment. (G) A significant trend is noted in the decrease of 68Ga-NOTA-MSA uptake with the increase in the duration of cyclosporine-A treatment. Cs-A, cyclosporine-A; SUV(R), standardized uptake value (ratio).Figure 7Comparison of 18F-FDG and 68Ga-NOTA-MSA PET for detection of myocardial inflammation in myocarditis.(A) The hotspots of myocardial inflammation colocalizes between the 18F-FDG and 68Ga-NOTA-MSA PET scans in some animals. (B~D) Different degree of 18F-FDG and 68Ga-NOTA-MSA uptake in spite of the similar degree of inflammatory cell infiltration. (B) Similar degree of inflammatory cell infiltration on ED-1 immunostaining. (C) Different degree of 18F-FDG uptake between the animals, despite similar degree of inflammatory cell infiltration. (D) Similar degree of 68Ga-NOTA-MSA uptake between the animals, matching the pathology findings on Figure 7B. SUV, standardized uptake value.Figure 8Utility of 68Ga-NOTA-MSA PET for early detection of myocardial inflammation in myocarditis before structural changes in the myocardium.(A) Representative 2-dimensional echocardiography images of the left ventricular (LV) short-axis view at baseline, week 1, 2 and 3 after initiation of immunization. There was no difference in the LV wall thickness during this period. (B) Representative 68Ga-NOTA-MSA PET images of the same rat in Figure 8A at baseline, week 1, 2 and 3 post-immunization. (C) Quantification of the 68Ga-NOTA-MSA on PET and LV wall thickness on echocardiography. Significant rise of the 68Ga-NOTA-MSA uptake is seen at week 2 on PET whereas the LV wall thickens at week 3 on echocardiography. The median value of each groups are shown as horizontal lines. SUV(R), standardized uptake value (ratio).
그림 출처: PubMed Central 공개 논문 (PMC5197074)
Conflict of interest statement
The authors have declared that no competing interest exists.