
JMIR Form Res. 2023;7:e44763.
Machine Learning Algorithms Predict Successful Weaning From Mechanical Ventilation Before Intubation: Retrospective Analysis From the Medical Information Mart for Intensive Care IV Database.
제1저자 김진철, 김윤관 · 교신저자 이한, 김형준
소속 (9)
- Division of Hematology-Oncology, Department of Internal Medicine, Inha University College of Medicine and Hospital, Incheon, Republic of Korea.
- Department of the Technology Development, Seers Technology Co, Ltd, Seongnam, Republic of Korea.
- Crowdworks Co, Ltd, Seoul, Republic of Korea.
- Healthcare Artificial Intelligence Team, National Cancer Center, Goyang, Republic of Korea.
- Department of Preventive Medicine, Yonsei University Wonju College of Medicine, Wonju, Republic of Korea.
- Department of Biomedical Systems Informatics, Yonsei University College of Medicine, Yongin, Republic of Korea.
- Asan Medical Center, Asan Institute for Life Sciences, Seoul, Republic of Korea.
- Division of Pulmonary and Critical Care Medicine, Department of Internal Medicine, Seoul National University Bundang Hospital, Seongnam, Republic of Korea.
- Department of Internal Medicine, Seoul National University College of Medicine, Seoul, Republic of Korea.
Abstract
BACKGROUND The prediction of successful weaning from mechanical ventilation (MV) in advance of intubation can facilitate discussions regarding end-of-life care before unnecessary intubation.
OBJECTIVE We aimed to develop a machine learning-based model that predicts successful weaning from ventilator support based on routine clinical and laboratory data taken before or immediately after intubation.
METHODS We used the Medical Information Mart for Intensive Care IV database, which is an open-access database covering 524,740 admissions of 382,278 patients in Beth Israel Deaconess Medical Center, United States, from 2008 to 2019. We selected adult patients who underwent MV in the intensive care unit (ICU). Clinical and laboratory variables that are considered relevant to the prognosis of the patient in the ICU were selected. Data collected before or within 24 hours of intubation were used to develop machine learning models that predict the probability of successful weaning within 14 days of ventilator support. Developed models were integrated into an ensemble model. Performance metrics were calculated by 5-fold cross-validation for each model, and a permutation feature importance and Shapley additive explanations analysis was conducted to better understand the impacts of individual variables on outcome prediction.
RESULTS Of the 23,242 patients, 19,025 (81.9%) patients were successfully weaned from MV within 14 days. Using the preselected 46 clinical and laboratory variables, the area under the receiver operating characteristic curve of CatBoost classifier, random forest classifier, and regularized logistic regression classifier models were 0.860 (95% CI 0.852-0.868), 0.855 (95% CI 0.848-0.863), and 0.823 (95% CI 0.813-0.832), respectively. Using the ensemble voting classifier using the 3 models above, the final model revealed the area under the receiver operating characteristic curve of 0.861 (95% CI 0.853-0.869), which was significantly better than that of Simplified Acute Physiology Score II (0.749, 95% CI 0.742-0.756) and Sequential Organ Failure Assessment (0.588, 95% CI 0.566-0.609). The top features included lactate and anion gap. The model's performance achieved a plateau with approximately the top 21 variables.
CONCLUSIONS We developed machine learning algorithms that can predict successful weaning from MV in advance to intubation in the ICU. Our models can aid the appropriate management for patients who hesitate to decide on ventilator support or meaningless end-of-life care.
©Jinchul Kim, Yun Kwan Kim, Hyeyeon Kim, Hyojung Jung, Soonjeong Koh, Yujeong Kim, Dukyong Yoon, Hahn Yi, Hyung-Jun Kim. Originally published in JMIR Formative Research (https://formative.jmir.org), 14.11.2023.
Keywords
algorithmsclinical decision-makingintensive care unitsnoninvasive ventilationorgan dysfunction scores
Figures
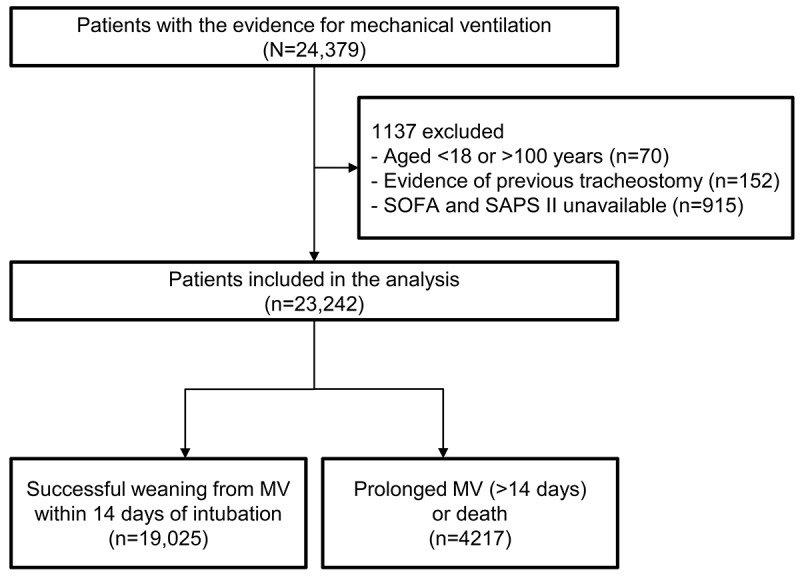
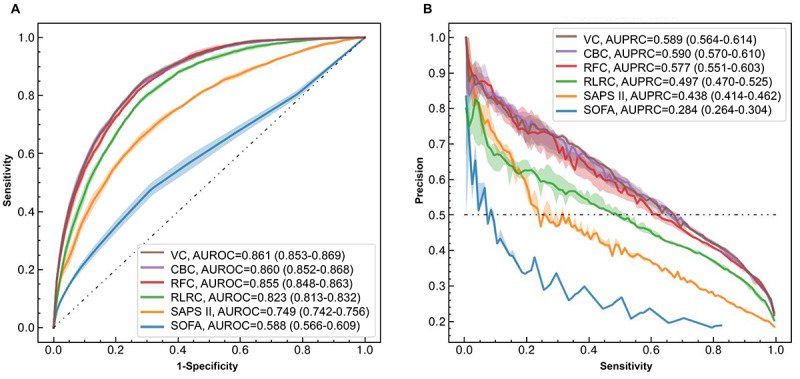
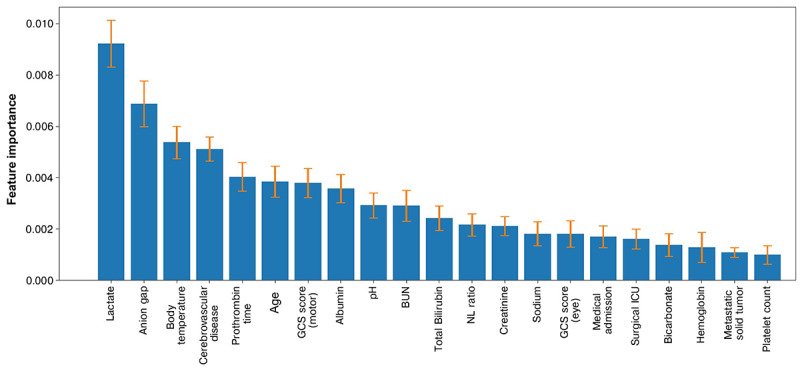
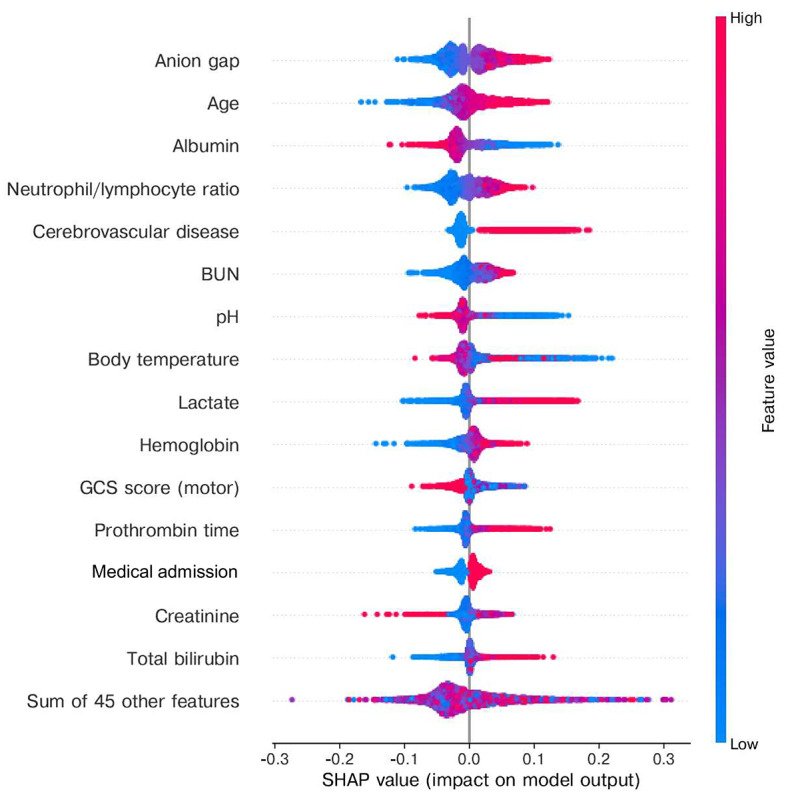
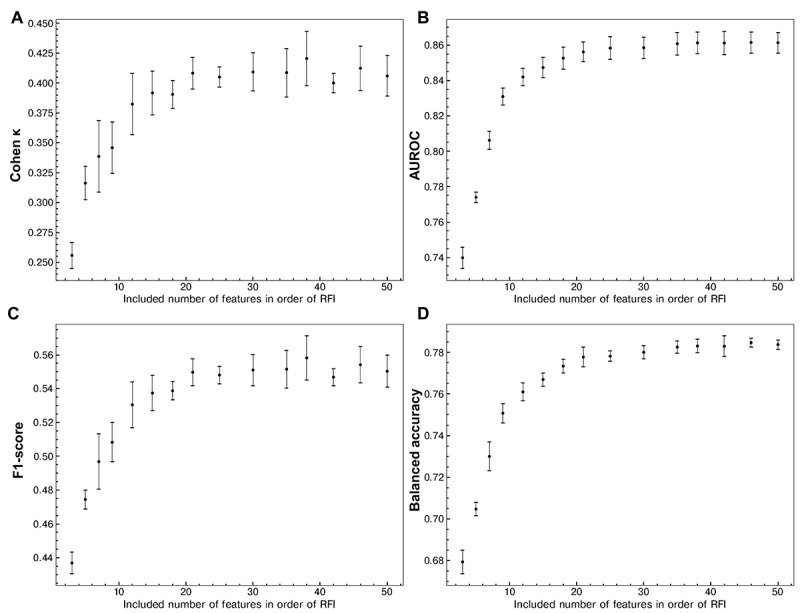
그림 출처: PubMed Central 공개 논문 (PMC10685278)
Conflict of interest statement
Conflicts of Interest: None declared.
그 밖의 정보
- 출판 형태
- Journal Article
- 저널
- JMIR formative research · eISSN 2561-326X
- 전자 출판
- 2023-11-14
- 참고문헌
- 48편