Department of Internal Medicine, Seoul National University Hospital, Seoul, Korea.
National Research Laboratory for Stem Cell Niche, Seoul National University Hospital, Seoul, Korea.
Innovative Research Institute for Cell Therapy, Seoul National University Hospital, Seoul, Korea.
Molecular Medicine and Biopharmaceutical Sciences, Seoul National University, Seoul, 03080, Korea.
Abstract
Resistin plays an important role in the pathophysiology of obesity-mediated insulin resistance in mice. However, the biology of resistin in humans is quite different from that in rodents. Therefore, the association between resistin and insulin resistance remains unclear in humans. Here, we tested whether and how the endocannabinoid system (ECS) control circulating peripheral blood mononuclear cells (PBMCs) that produce resistin and infiltrate into the adipose tissue, heart, skeletal muscle, and liver, resulting in inflammation and insulin resistance. Using human PBMCs, we investigate whether the ECS is connected to human resistin. To test whether the ECS regulates inflammation and insulin resistance in vivo, we used 2 animal models such as "humanized" nonobese diabetic/Shi-severe combined immunodeficient interleukin-2Rγ (null) (NOG) mice and "humanized" resistin mouse models, which mimic human body. In human atheromatous plaques, cannabinoid 1 receptor (CB1R)-positive macrophage was colocalized with the resistin expression. In addition, resistin was exclusively expressed in the sorted CB1R-positive cells from human PBMCs. In CB1R-positive cells, endocannabinoid ligands induced resistin expression via the p38-Sp1 pathway. In both mouse models, a high-fat diet increased the accumulation of endocannabinoid ligands in adipose tissue, which recruited the CB1R-positive cells that secrete resistin, leading to adipose tissue inflammation and insulin resistance. This phenomenon was suppressed by CB1R blockade or in resistin knockout mice. Interestingly, this process was accompanied by mitochondrial change that was induced by resistin treatment. These results provide important insights into the ECS-resistin axis, leading to the development of metabolic diseases. Therefore, the regulation of resistin via the CB1R could be a potential therapeutic strategy for cardiometabolic diseases.
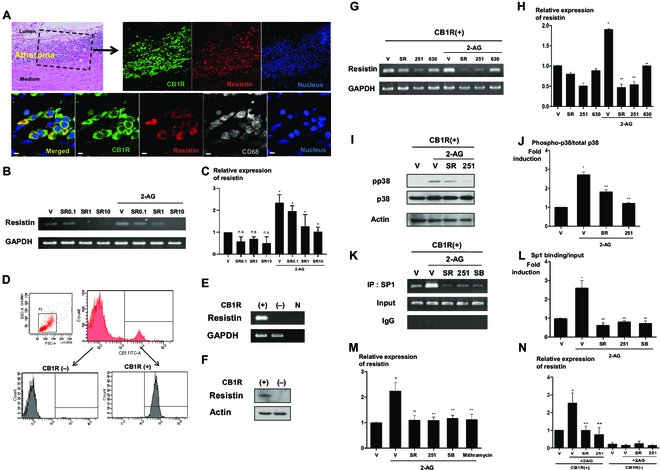
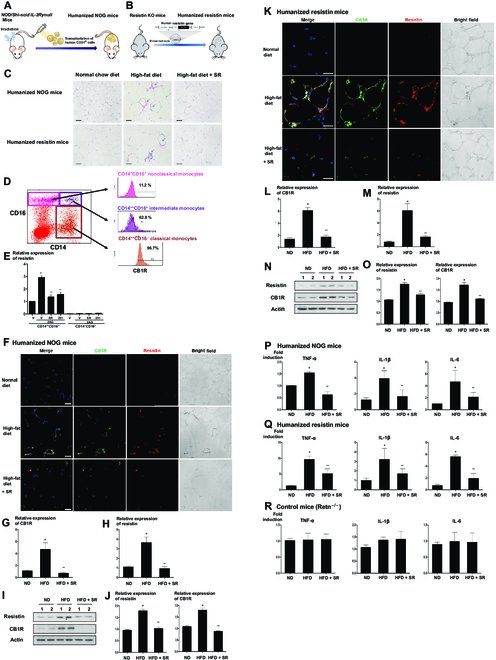
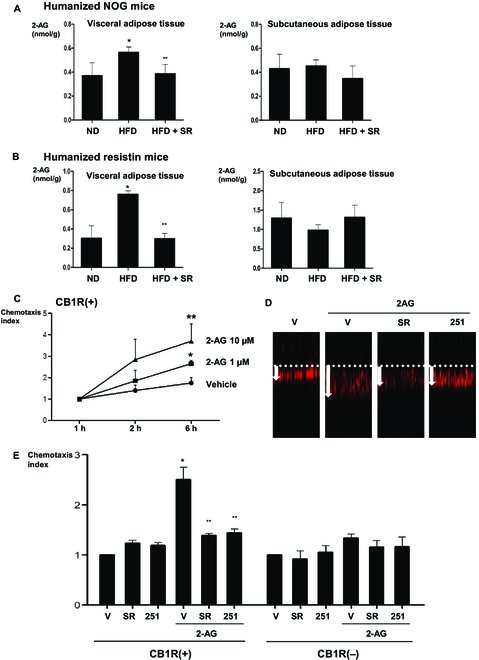
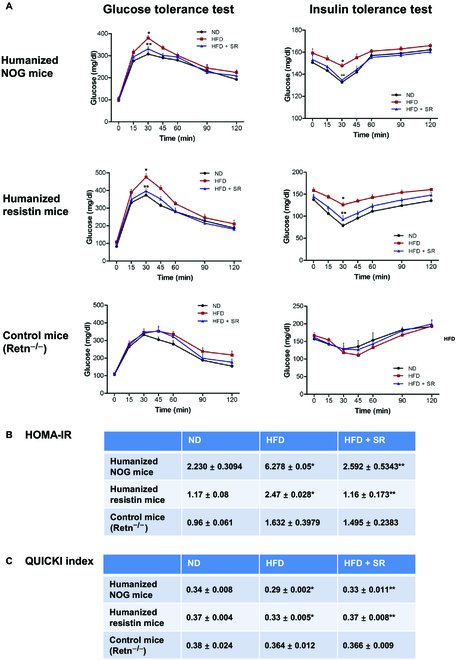
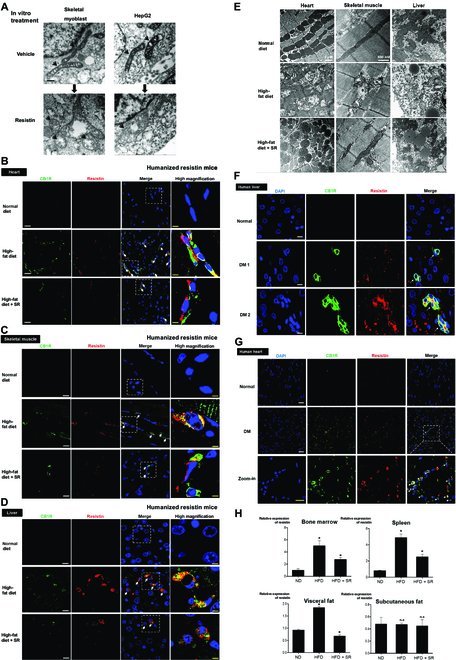
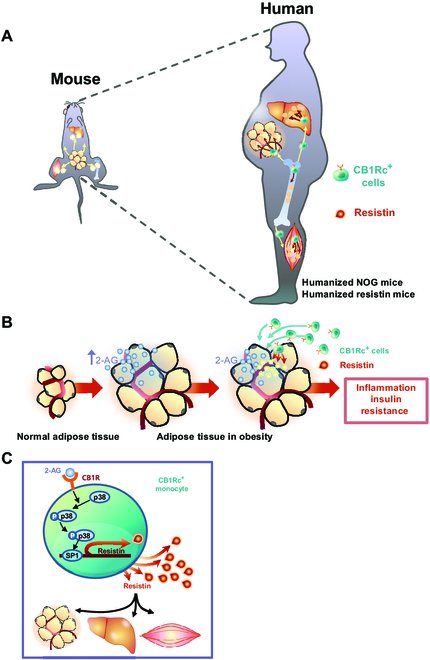
Fig. 1.The ECS regulates resistin expression in CB1R-positive PBMCs. (A) CB1R and resistin expression in human arteries. Immunofluorescence for CB1R and resistin in human atheromatous artery. Green, CB1R; red, resistin; gray, CD68; sytox blue, nuclei. Scale bars, 10 μm. (B and C) Resistin expression in human PBMCs. Human PBMCs were treated with 10 μM 2-AG, a ligand of the ECS, with (or without) 0.1, 1, and 10 μM SR141716, a CB1R antagonist. Cells were harvested, and real-time PCR was performed for resistin (*P < 0.01, vehicle versus 2-AG, 2-AG + V versus 2-AG + SR141716; n = 3; hereafter, n represents the number of biological replicates). n.s., not significant; V, vehicle; SR, SR141716. (D to F) CB1R-positive cell sorting and resistin expression in CB1R-positve cells. (D) FACS for CB1-positive cells and purities of the isolated cells confirmed by FACS analysis. FITC, fluorescein isothiocyanate. SSC-A, side scatter area; FSC-A, foward scatter area. Resistin expression in sorted CB1R-positive cells, as determined by real-time PCR (E) and Western blot assay (F). N indicates the negative control. (G and H) Resistin expressions following treatment with 10 μM 2-AG with or without 1 μM SR141716 and 10 μM AM251 (a CB1R antagonist) in CB1R-positive cells, as determined by real-time PCR. AM630, a CB2R antagonist (*P < 0.01, vehicle versus 2-AG; **P < 0.01, 2-AG + V versus 2-AG + SR141716 or AM251; n = 4). 251, AM251; 630, AM630. (I and J) Western blot analysis of p38 phosphorylation in CB1R-positive cells treated with 10 μM 2-AG, 1 μM SR141716, and 10 μM AM251. (*P < 0.01, vehicle versus 2-AG; **P < 0.01, 2-AG + V versus 2-AG + SR141716 or AM251; n = 4). pp38, phospho-p38. (K and L) ChIP assay for the resistin promoter showed that the increased expression of resistin induced by 2-AG was induced by the enhanced binding of Sp1 on the promoter region of resistin. The increased binding activity of Sp1 induced by 2-AG was reversed by treatment with 1 μM SR141716, 10 μM AM251, and 5 μM SB203580 (a p38 inhibitor) (*P < 0.01, vehicle versus 2-AG; **P < 0.01, 2-AG + V versus 2-AG + SR141716, AM251 or SB203580; n = 4). SB, SB203580; IgG, immunoglobulin G. (M) Real-time PCR for resistin in CB1R-positive cells treated with 10 μM 2-AG, 1 μM SR141716, 10 μM AM251, 5 μM SB203580, and mithramycin. Moreover, mithramycin, a Sp1 inhibitor, reversed the increased expression of resistin induced by 2-AG treatment. (*P < 0.01, vehicle versus 2-AG; **P < 0.01, 2-AG + V versus 2-AG + SR141716, AM251, SB203580, or mithramycin; n = 4). (N) Real-time PCR for resistin in CB1R-negative and -positive cells treated with 10 μM 2-AG, 1 μM SR141716, 10 μM AM251, and 5 μM SB203580. Resistin expression was affected only in CB1R-positive fraction (*P < 0.01, vehicle versus 2-AG; **P < 0.01, 2-AG + V versus 2-AG + SR141716, AM251 or SB203580; n = 3).Fig. 2.The ECS regulates inflammation in vivo by the infiltration of resistin-secreting CB1R-positive cells. (A and B) Schematic figures of 2 in vivo models. (A) To generate humanized NOG mice, the NOG mice were irradiated, and 1 × 10⁵ human CD34-positive cells were transplanted through tail vein injection. (B) Humanized resistin mice were generated after inserting human resistin gene into the monocyte of resistin knockout (KO) mice. (C) Hematoxylin and eosin staining of visceral adipose tissues. CLSs are indicated by arrows. (D) The FACS of PBMCs into several fractions according to the expression of CD14 and CD16. The CD14++ CD16− fraction of cells, considered as classical subsets of human monocytes, was mostly CB1R-positive cells. (E) In the CD14++ CD16− fraction of cells having CB1R, 2-AG treatment significantly increased resistin expression, which was reversed by CB1R antagonists, SR141716 or AM251 (*P < 0.01, vehicle versus 2-AG; **P < 0.01, 2-AG + V versus 2-AG + SR141716 or AM251; n = 4). (F to J) Visceral adipose tissues of humanized NOG mice (F) and humanized resistin mice (K). Mice were fed with a normal diet and a high-fat diet with or without intraperitoneally injected SR141716 for 8 weeks. Green, CB1R; red, resistin; 4′,6-diamidino-2-phenylindole, nuclei. Scale bars, 10 μm. Real-time PCR (G, H, L, and M) and Western blot analysis of CB1R and resistin in visceral adipose tissues of humanized NOG mice and humanized resistin mice (I, J, N, and O) (*P < 0.05, ND versus HFD; **P < 0.05, HFD versus HFD + SR; n = 4). ND, normal chow diet; HFD, high-fat diet. (P to R) Proinflammatory gene expressions by real-time PCR in visceral adipose tissues. TNF-α, IL-1β, and IL-6 in humanized NOG mice and humanized resistin mice, respectively (*P < 0.05, ND versus HFD; **P < 0.05, HFD versus HFD + SR; n = 4).Fig. 3.Migration of CB1R-positive cells induced by 2-AG and different 2-AG levels in adipose tissues. (A and B) 2-AG levels in visceral and subcutaneous adipose tissues of humanized NOG mice and humanized resistin mice measured by LC-MS/MS (*P < 0.05, ND versus HFD; **P < 0.05, HFD versus HFD + SR; n = 4). (C to E) CB1R-positive cells and CB1R-negative cells were added to the transwell insets, and 2-AG was added at 1 and 10 μM concentrations to the lower compartment. Incubation was carried out for the indicated periods of time (* P < 0.05, V versus 2-AG 1 μM; **P < 0.05, V versus 2-AG 10 μM; n = 4). (D) Representative figure of each group in the transwell migration assay. (E) Cells were pretreatment with vehicle, 1 μM SR141716, and 10 μM AM251; they were then added to the transwell inserts. The migration of the cells from the upper to lower compartment was measured (* P < 0.01, vehicle versus 2-AG; **P < 0.01, 2-AG + V versus 2-AG + SR141716 or AM251; n = 4).Fig. 4.Glucose homeostasis in humanized NOG mice and humanized resistin mice. (A) Mice were fed with a normal diet or a high-fat diet; SR141716 was intraperitoneally injected for 8 weeks. Glucose tolerance test was measured at times 0, 15, 30, 45, 60, 90, and 120 min. Insulin tolerance test was measured at times 0, 15, 30, 45, 60, 90, and 120 min (*P < 0.05, ND versus HFD; **P < 0.05, HFD versus HFD + SR; n = 8 to 10) (B) Glucose (in milligrams per decaliter), insulin (in nanograms per milliliter) levels, HOMA-IR, and the QUICKI were determined (*P < 0.05, ND versus HFD; **P < 0.05, HFD versus HFD + SR; n = 8 to 10).Fig. 5.Insulin resistance facilitated by resistin may be associated with mitochondrial dysfunction induced by resistin. (A) Electron microscopic image of resistin treated human myoblast and hepatocellular carcinoma cells (HepG2) treated with resistin (50 ng/ml) for 3 h. It shows mitochondrial swelling, decreased matrix density, and distorted mitochondrial cristae in both cell types. Arrows indicate mitochondria. Scale bar, 100 nm. (B to D) The extent of the infiltrated cells secreting resistin was measured in target tissues such as the skeletal muscles, liver, and the heart. The high-fat diet-fed group showed increased number of resistin-positive cells in each organ, which was reversed by treatment with SR141716. Arrowheads indicate the cells that are positive for CB1R and resistin. Scare bars for immunofluorescence staining, 10 μm (for low power field) and 2.5 μm (for high power field). (E) Electron microscopy demonstrated that a high-fat diet changed the morphology of mitochondria into the swollen form, as seen in in vitro experiments. This change was reversed by treatment with SR141716. (F and G) Double immunofluorescence staining of human tissues such as the heart and liver between non-DM (normal) versus obese-DM (DM, diabetes mellitus) subject. Obese-DM subject showed a strong coexpression of infiltrated CB1R+ resistin+ monocytes (white arrows). Scare bars for immunofluorescence staining, 25 μm (for low power field) and 10 μm (for high power field). (H) Expression levels of resistin were measured in tissues of humanized resistin mouse models. Real-time PCR resistin in the bone marrow, spleen, visceral and subcutaneous fat of humanized resistin mice shows that high-fat diet group increased resistin expression that was reversed by SR141716 treatment (*P < 0.05, ND versus HFD, HFD versus HFD + SR; n.s., not significant; n = 4).Fig. 6.Schematic figure of CB1R-positive cells producing resistin. (A) CB1R-positive cells that secrete resistin may serve as mediators that elucidate the discrepancy between in mice and in humans in terms of the role of resistin in inducing insulin resistance. Mouse resistin is produced from adipose tissues; in contrast, human resistin is secreted by monocytes and macrophages. Owing to pathophysiological differences between mice and humans, we utilized animal models, such as humanized NOG mice and humanized resistin mice. (B) In both mouse models, a high-fat diet, which mimics the status of human obesity, increased the level of 2-AG in the visceral adipose tissue. Increased level of endocannabinoid ligands recruits the CB1R-positive cells into the target tissues, such as the adipose tissue, liver, and skeletal muscle. Mobilized CB1R-positive cells secrete resistin, which induces inflammation and insulin resistance in those tissues. (C) Resistin expression in CB1R-positive cells is regulated through the p38–Sp1 pathway.
그림 출처: PubMed Central 공개 논문 (PMC11267475)
Conflict of interest statement
Competing interests: The authors declare that they have no competing interests.