National Research Laboratory for Stem Cell Niche, Seoul National University College of Medicine, 101 Daehak-ro, Jongno-gu, Seoul, Korea.
Innovative Research Institute for Cell Therapy, Seoul National University Hospital, 101 Daehak-ro, Jongno-gu, Seoul, Korea.
Department of Molecular Medicine and Biopharmaceutical Sciences, Graduate School of Convergence Science and Technology, and College of Medicine or College of Pharmacy, Seoul National University, 101 Daehak-ro, Jongno-gu, Seoul, Korea.
Cardiovascular Center &Department of Internal Medicine, Seoul National University Hospital, 101 Daehak-ro, Jongno-gu, Seoul, Korea.
Abstract
The inhibitors of CD26 (dipeptidyl peptidase-4; DPP4) have been widely prescribed to control glucose level in diabetic patients. DPP4-inhibitors, however, accumulate stromal cell-derived factor-1α (SDF-1α), a well-known inducer of vascular leakage and angiogenesis both of which are fundamental pathophysiology of diabetic retinopathy. The aim of this study was to investigate the effects of DPP4-inhibitors on vascular permeability and diabetic retinopathy. DPP4-inhibitor (diprotin A or sitagliptin) increased the phosphorylation of Src and vascular endothelial-cadherin (VE-cadherin) in human endothelial cells and disrupted endothelial cell-to-cell junctions, which were attenuated by CXCR4 (receptor of SDF-1α)-blocker or Src-inhibitor. Disruption of endothelial cell-to-cell junctions in the immuno-fluorescence images correlated with the actual leakage of the endothelial monolayer in the transwell endothelial permeability assay. In the Miles assay, vascular leakage was observed in the ears into which SDF-1α was injected, and this effect was aggravated by DPP4-inhibitor. In the model of retinopathy of prematurity, DPP4-inhibitor increased not only retinal vascularity but also leakage. Additionally, in the murine diabetic retinopathy model, DPP4-inhibitor increased the phosphorylation of Src and VE-cadherin and aggravated vascular leakage in the retinas. Collectively, DPP4-inhibitor induced vascular leakage by augmenting the SDF-1α/CXCR4/Src/VE-cadherin signaling pathway. These data highlight safety issues associated with the use of DPP4-inhibitors.
Figures
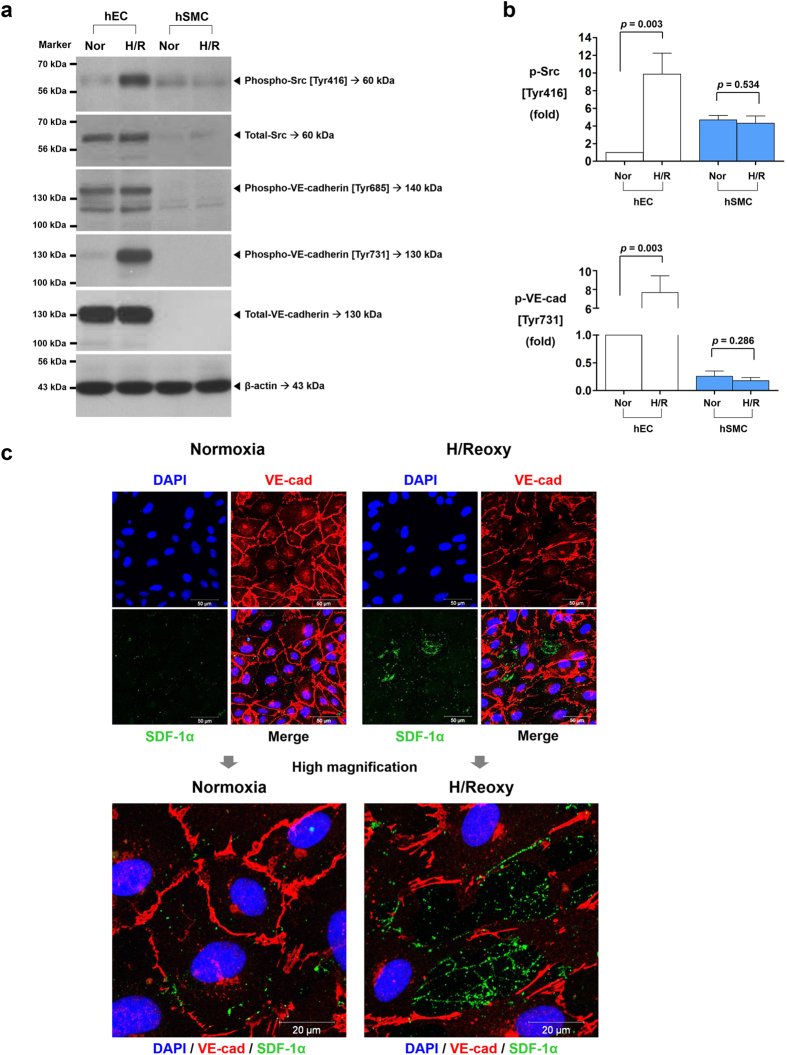
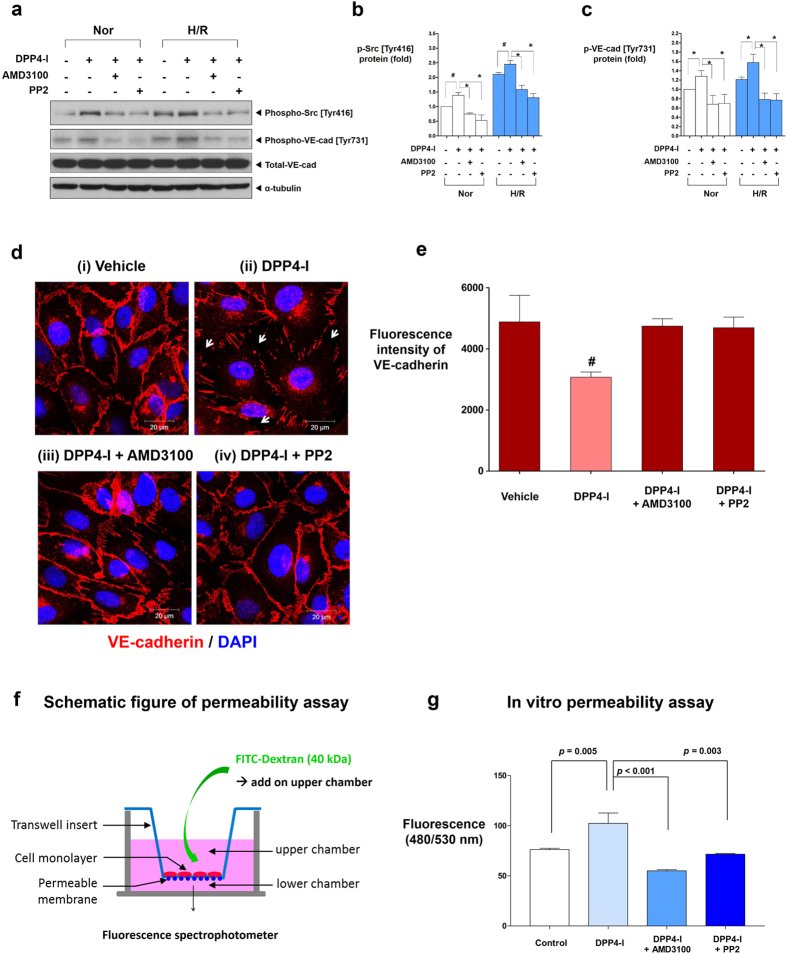
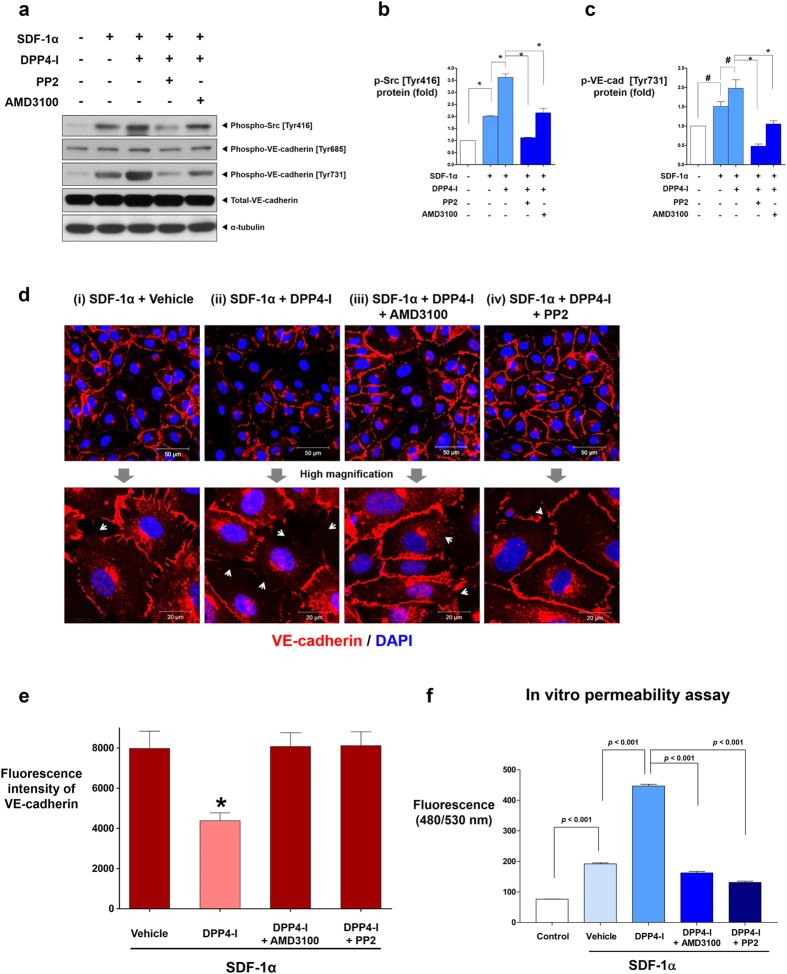
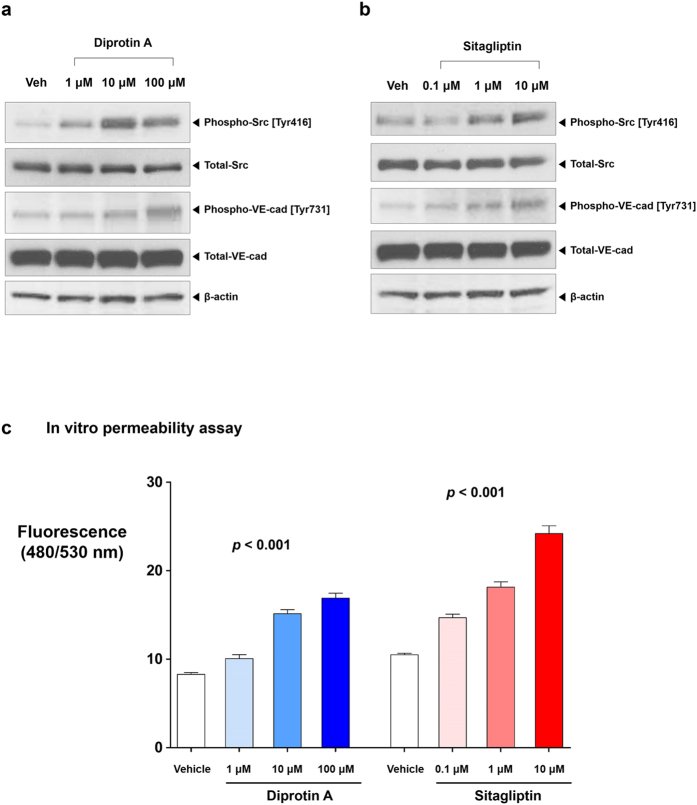
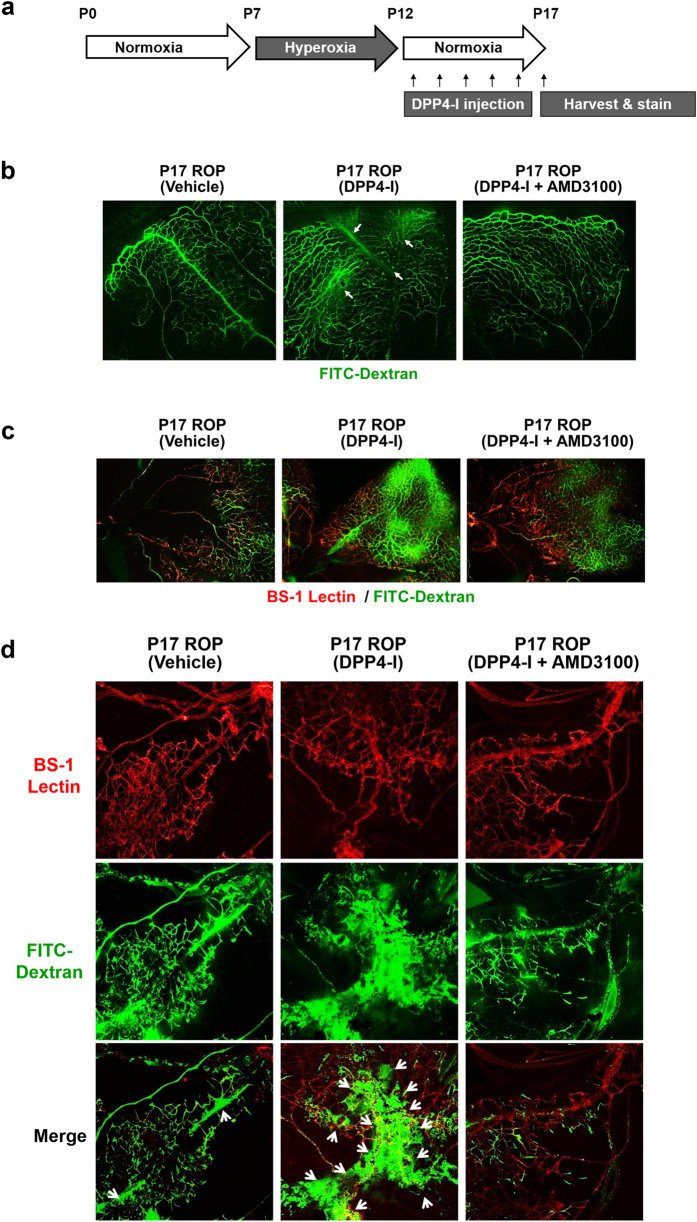
Figure 1 Expression of SDF-1α, CXCR4, and DPP4 in human vascular cells under normoxia and H/R. The main source of SDF-1α was hSMCs, while its receptor CXCR4 was mainly expressed on hECs. DPP4, a regulatory enzyme to degrade SDF-1α, was mainly expressed in hSMCs. H/R significantly increased SDF-1α expression compared with normoxic condition in both hECs and hSMCs. However, H/R did not affect the mRNA or protein expression levels of CXCR4 and DPP4 in both hECs and hSMCs. (a) RT-qPCR analysis of SDF-1α mRNA (n = 6). Bars represent relative quantification values. Error bars denote relative quantification maximum values. (b) ELISA of SDF-1α protein in culture supernatants (n = 2). Data are shown as means ± SD. (c) RT-qPCR analysis of CXCR4 mRNA (n = 6). Bars represent relative quantification values. Error bars denote relative quantification maximum values. (d) RT-qPCR analysis of DPP4 mRNA (n = 6). Bars represent relative quantification values. Error bars denote relative quantification maximum values. (e) FACS analysis of CXCR4 and DPP4 protein on the surface of hECs and hSMCs. (f) Western blot analysis of CXCR4 and DPP4. (g) Quantification graphs of the western blot (n = 4). Data are shown as means ± SD. p values are determined by Student’s t test. DPP4: dipeptidyl peptidase-4; hECs: human endothelial cells; hSMCs: human vascular smooth muscle cells; H/R: hypoxia/reoxygenation; Nor: normoxia; SD: standard deviations; SDF-1α: stromal cell derived factor-1α.Figure 2 Activation of Src kinase during H/R leads to VE-cadherin [Tyr731] phosphorylation and disruption of cell-to-cell junctions. H/R activated Src kinase mediated phosphorylation of VE-cadherin [Tyr731], leading to disruption of cell-to-cell junctions in hECs monolayer culture, suggesting the existence of autocrine pathway of the SDF-1α/CXCR4/Src/VE-cadherin signaling cascade in hECs. (a) Western blot analysis of phosphorylated Src and VE-cadherin under normoxia and H/R. (b) Quantification graphs of the western blot (n = 3). (c) Nuclei (blue), VE-cadherin (red), and SDF-1α (green) were separately stained and merged. H/R disrupted VE-cadherin cell-to-cell junctions, which coincided with the SDF-1α expression. All data are shown as means ± SD. p values are determined by Student’s t test. DAPI: 4′,6-diamidino-2-phenylindole; H/Reoxy: hypoxia/reoxygenation; p-Src: phosphorylated Src; p-VE-cad: phosphorylated VE-cadherin; Tyr: tyrosine; VE-cadherin and VE-cad: vascular endothelial-cadherin. Other abbreviations as in Fig. 1.Figure 3 DPP4-inhibitor induces phosphorylation of Src [Tyr416] and VE-cadherin [Tyr731] which leads to cell-to-cell junction disruption and endothelial leakage. (a) DPP4-inhibitor (DipA; 100 μM) induced the phosphorylation of Src [Tyr 416] and VE-cadherin [Tyr731] in hECs in both normoxia and H/R conditions, which was reversed by CXCR4-blocker (AMD3100; 1 μg/ml) or Src-inhibitor (PP2; 1 μM). (b,c) Quantification graphs of the western blot (*p < 0.01, #p < 0.05; n = 3–5). (d) Confluent cultures of hECs were either (i) left untreated, (ii) treated with DPP4-inhibitor, (iii) pre-treated with AMD3100 and then treated with DPP4-inhibitor, (iv) pre-treated with PP2 and then treated with DPP4-inhibitor. VE-cadherin cell-to-cell junctions were disrupted after treatment with DPP4-inhibitor, which was prevented by CXCR4-blocker or Src-inhibitor. (e) Fluorescence intensity quantification of VE-cadherin of (d) (#p < 0.05 compared to all other groups; n = 3 for each group). (f) Experimental scheme of endothelial permeability assay. (g) Endothelial permeability is increased after adding DPP4-inhibitor to the upper chamber which was attenuated by CXCR4-blocker or Src-inhibitor pre-treatment (n = 5 for each group; molecular weight of FITC-dextran: 40 kDa; DipA treatment time: 60 min; time for permeance: 20 min). All data are shown as means ± SD. p values are determined by Student’s t test. DipA: diprotin A; DPP4-I: dipeptidyl peptidase-4 inhibitor; FITC-dextran: fluorescein isothiocyanate conjugated-dextran. Other abbreviations as in Figs 1 and 2. White arrows indicate cell-to-cell junction breakage.Figure 4 The effects of DPP4-inhibitor under the influence of SDF-1α. (a) SDF-1α (100 μM) increased the phosphorylation of Src [Tyr416] and VE-cadherin [Tyr731] which was further augmented by DPP4-inhibitor (DipA; 100 μM). CXCR4-blocker (AMD3100; 1 μg/ml) and Src-inhibitor (PP2; 1 μM) blocked the effects of SDF-1α and DPP4-inhibitor. (b,c) Quantification graphs of the western blot (*p < 0.01, #p < 0.05; n = 3 for each group). (d) The effects of DPP4-inhibitor on VE-cadherin cell-to-cell junction integrity under the influence of SDF-1α is shown. VE-cadherin cell-to-cell junctions were further disrupted by adding DPP4-inhibitor after SDF-1α treatment, which was attenuated by CXCR4-blocker or Src-inhibitor pre-treatment. (e) Fluorescence intensity quantification of VE-cadherin of (d) (*p < 0.01 compared to all other groups; n = 3 for each group). (f) The results of the in-vitro transwell endothelial permeability assay. SDF-1α alone increased endothelial permeability. Combination of DPP4-inhibitor with SDF-1α further increased endothelial permeability. CXCR4-blocker and Src-inhibitor pre-treatment attenuated the effects of SDF-1α and DPP4-inhibitor on endothelial permeability (n = 5 for each group; molecular weight of FITC-dextran: 40 kDa; DipA treatment time: 60 min; time for permeance: 20 min). All data are shown as means ± SD. p values are determined by Student’s t test. Abbreviations as in Figs 1, 2, 3. White arrows indicate cell-to-cell junction breakage.Figure 5 Dose-response relationships of DipA and sitagliptin. DipA (a) and sitagliptin (b) increased the phosphorylation of Src [Tyr416] and VE-cadherin [Tyr731] in a dose dependent manner. (c) DipA and sitagliptin increased endothelial permeability in a dose dependent manner. p values of 6 possible pair-wise comparisons were all <0.01 for both groups (n = 5 for each group; molecular weight of FITC-dextran: 40 kDa; DipA and sitagliptin treatment time: 30 min; time for permeance: 5 min). All data are shown as means ± SD. Analysis of covariance with post hoc analysis using Bonferroni’s correction was applied for statistical analysis. Veh: vehicle. Other abbreviations as in Figs 1, 2, 3.Figure 6 The Miles assay - in-vivo effects of DPP4-inhibitor. (a) The photographs of both ears of mice under various conditions. Leakage of the dye to the adjacent tissue was seen after treatment with SDF-1α and DPP4-inhibitor, which was reduced by CXCR4-blocker or Src-inhibitor. (b) Evans blue dye extravasation to the adjacent tissue was quantified (n = 3–5 for each group). All data are shown as means ± SD. p values are determined by Student’s t test. Abbreviations as in Figs 1, 2, 3.Figure 7 The effects of DPP4-inhibitor on retinal vasculature - retinopathy of prematurity model. (a) Schematic illustration of the experiment. (b) Compared with the vehicle, DPP4-inhibitor (DipA; 70 μg/kg twice daily) made aberrant and leaky vessels in P17 retina, which was prevented by CXCR4-blocker (AMD3100; 7.5 mg/kg). (c,d) All micrographs are merged confocal images of the retinal flat mounts. Evident extravasation of FITC-dextran was demonstrated in the DPP4-inhibitor treated P17 retina compared to the P17 vehicle. CXCR4-blocker treatment neutralized the effects of DPP4-inhibitor. BS-1 lectin: Bandeiraea simplicifolia lectin 1; P0: postnatal day 0; P7: postnatal day 7; P12: postnatal day 12; P17: postnatal day 17; ROP: retinopathy of prematurity. Other abbreviations as in Figs 1, 2, 3. White arrows indicate vascular leakage.Figure 8 The effects of DPP4-inhibitor on retinal vasculature - diabetic retinopathy model. (a) Schematic illustration of the experiment. The experiment consisted of control group (n = 10), STZ-induced (180 mg/kg single dose) diabetic group (n = 9), STZ + DPP4-inhibitor (DipA; 70 μg/kg twice daily) group (n = 12), STZ + DPP4-inhibitor + CXCR4-blocker (AMD3100; 7.5 mg/kg) group (n = 5), and STZ + DPP4-inhibitor + Src-inhibitor (PP2; 1 mg/kg) group (n = 5). (b) The phosphorylation of Src [Tyr416] and VE-cadherin [Tyr731] was increased in the retinal tissue of STZ-induced diabetic mouse compared to the control. DPP4-inhibitor further increased the phosphorylation of Src [Tyr416] and VE-cadherin [Tyr731] in the retinal tissue. CXCR4-blocker or Src-inhibitor neutralized the effects of DPP4-inhibitor. (c,d) Quantification graphs of the western blot (*p < 0.01, #p < 0.05; n = 3 for each group). (e,f) Confocal images of the retinal flat mounts and its quantification graph (n = 4–7 for each group). Increased vascular leakage in the retina was observed in the diabetic mice group compared to the control. DPP4-inhibitor further aggravated vascular leakage in the retina which was neutralized by CXCR4-blocker or Src-inhibitor. (g) Merged confocal images of the retinal flat mounts. Note the increased vascular leakage after DPP-4 inhibitor treatment. All data are shown as means ± SD. p values are determined by Student’s t test. STZ: streptozotocin; STZ-DR: streptozotocin induced diabetic retinopathy. Other abbreviations as in Figs 1, 2, 3. White arrows indicate vascular leakage.