Department of Internal Medicine, Seoul National University Bundang Hospital, Seongnam, Korea.
Department of Internal Medicine and Liver Research institute, Seoul National University College of Medicine, Seoul, Korea.
Laboratory of Immunology, Division of Biotechnology Review and Research-III, Office of Biotechnology Products, Center for Drug Evaluation and Research, Food and Drug Administration, Silver Spring, MD, USA.
Abstract
PURPOSE Sex hormones are known to affect the gut microbiota. Previously, we reported that endogenous and exogenous testosterone are associated with colorectal cancer (CRC) development and submucosal invasion. In the present study, we investigated whether the gut microbiota is affected by orchiectomy (ORX) and testosterone propionate (TP) administration using an azoxymethane/dextran sulfate sodium (AOM/DSS)-induced CRC mouse model.
MATERIALS AND METHODS Gut microbiota was evaluated by means of 16S rRNA gene sequencing of stool DNA extracted from feces that were obtained at 13 weeks after AOM injection (from 22-week-old animals) and stored in a gas-generating pouch.
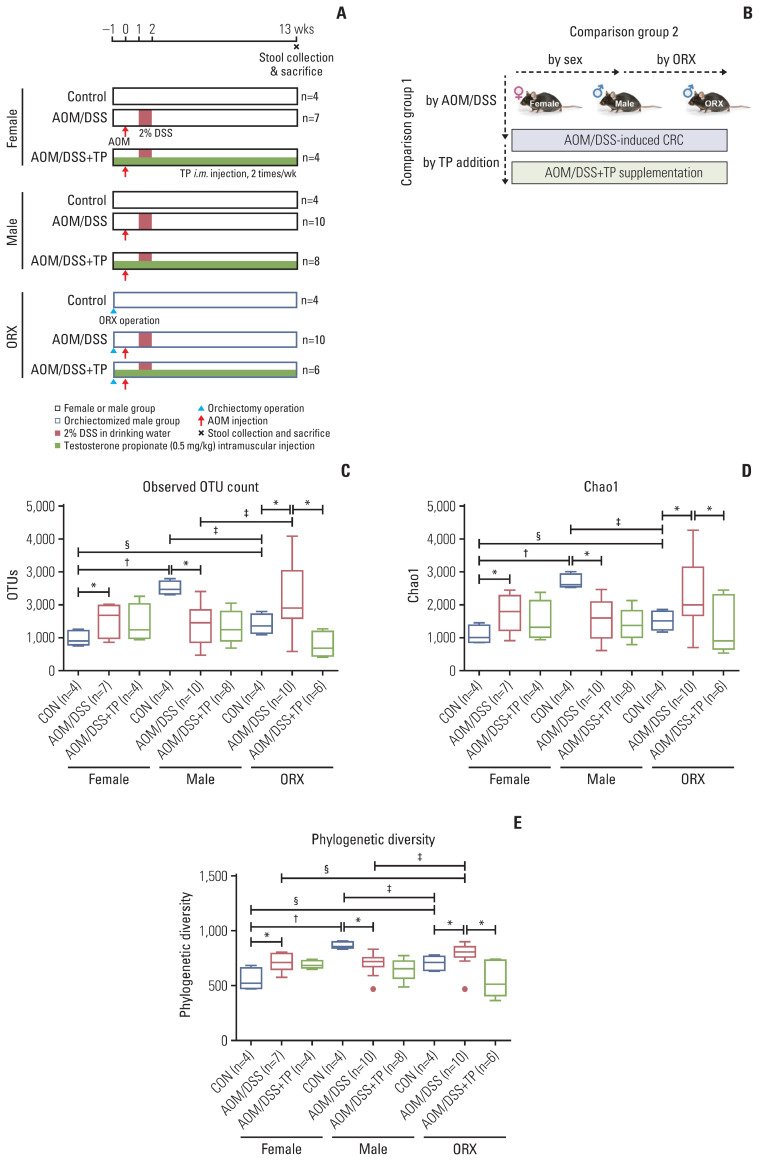
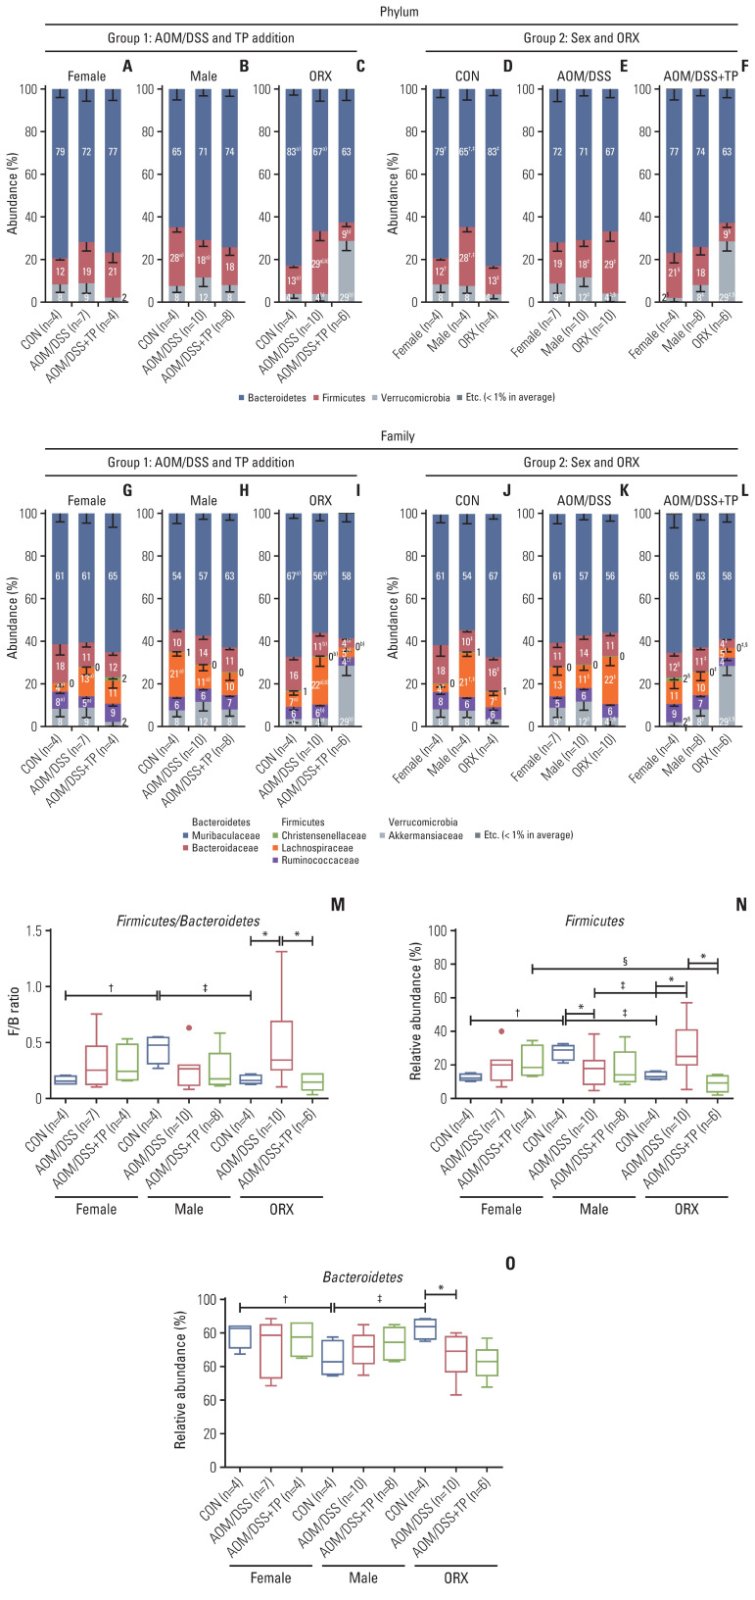
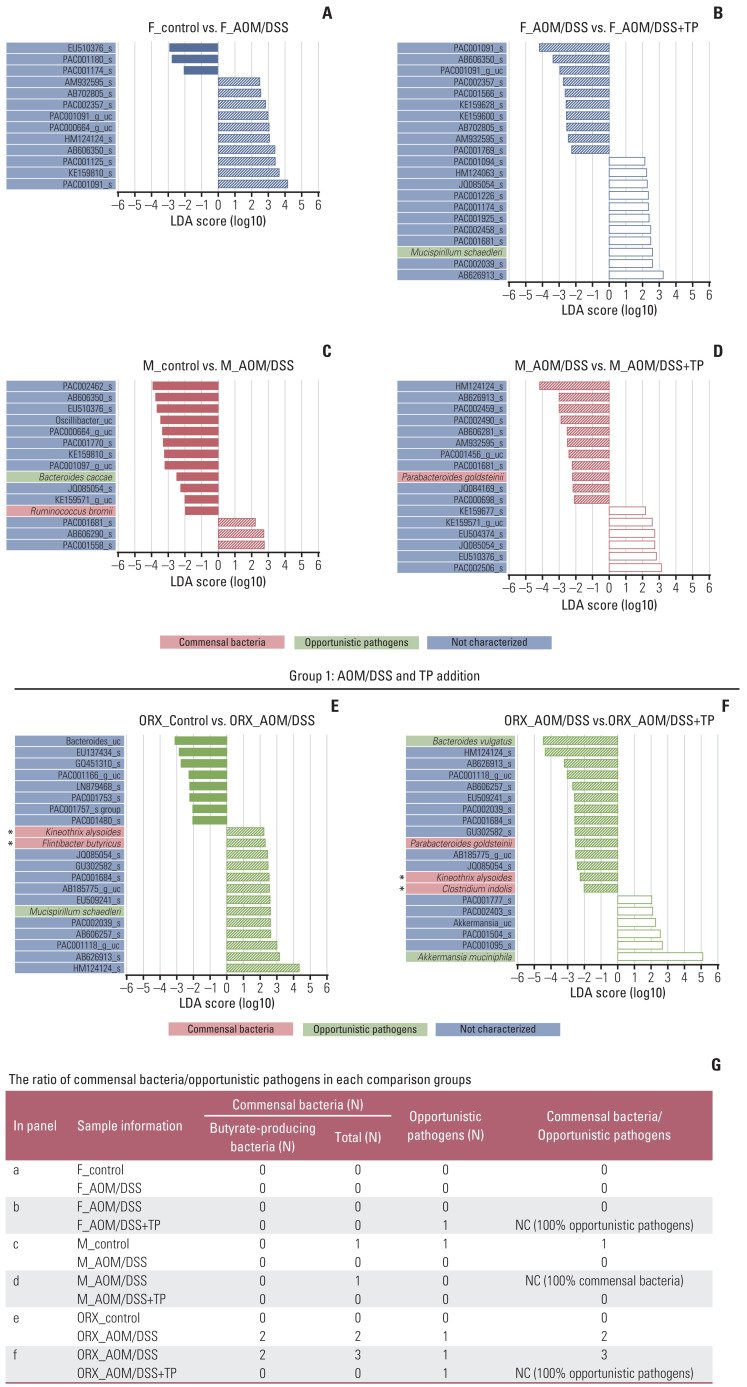
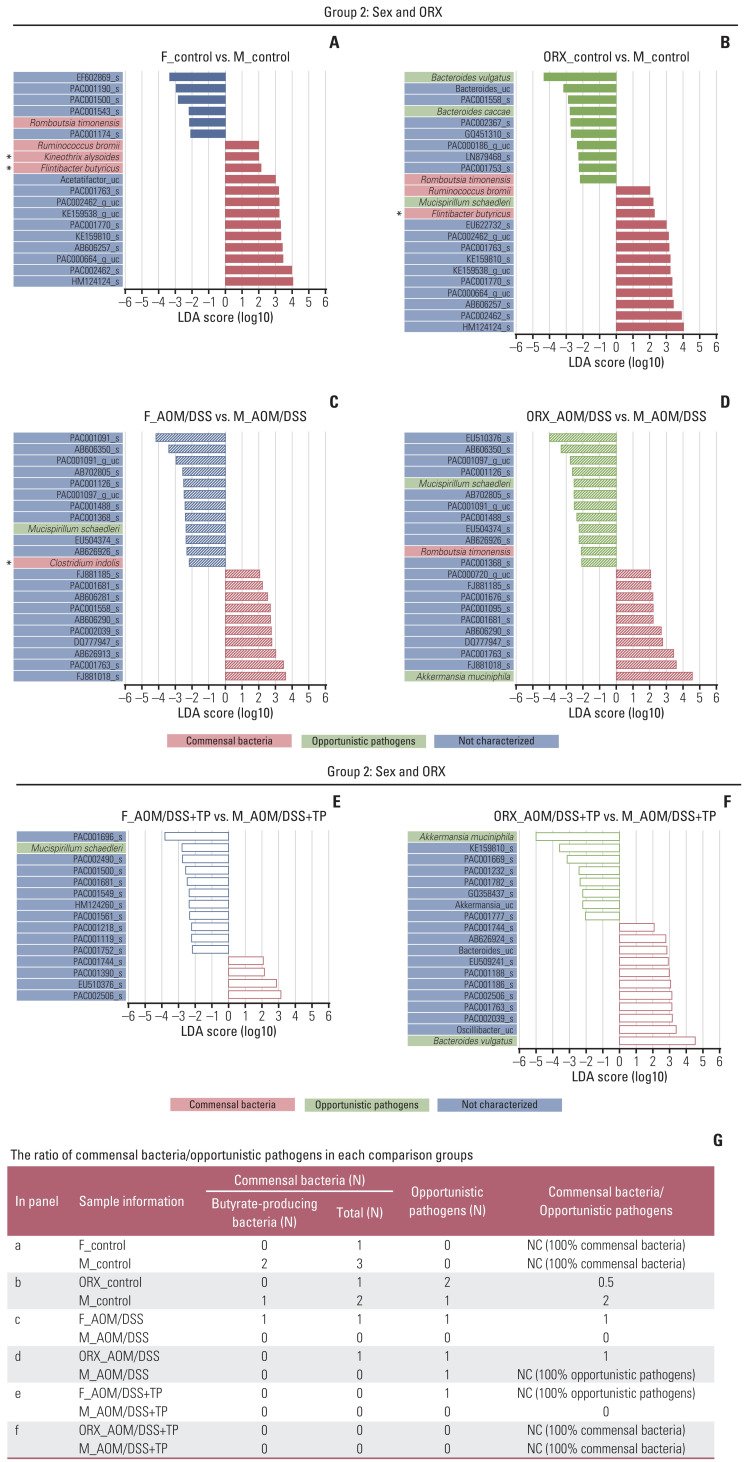
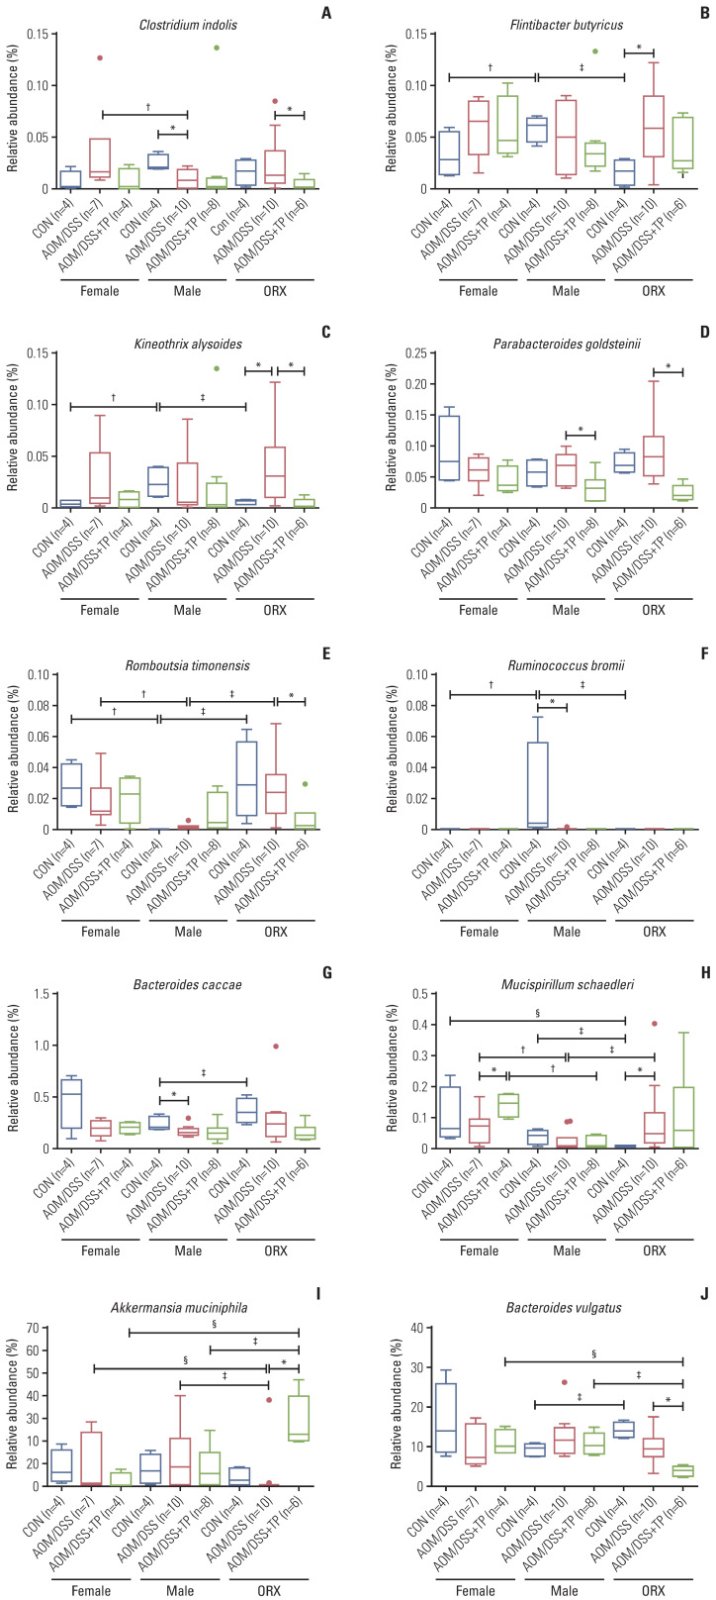
RESULTS The increase in microbial diversity (Chao1 and Phylogenetic Diversity index) and Firmicutes/Bacteroidetes (F/B) ratio upon AOM/DSS treatment in ORX mice was significantly decreased by TP supplementation. The ratio of commensal bacteria to opportunistic pathogens was lower in the TP-administered females and ORX mice than in the AOM/DSS group. Opportunistic pathogens (Mucispirillum schaedleri or Akkermansia muciniphila) were identified only in the TP group. In addition, microbial diversity and F/B ratio were higher in male controls than in female and ORX controls. Flintibacter butyricus, Ruminococcus bromii, and Romboutsia timonensis showed similar changes in the male control group as those in the female and ORX controls.
CONCLUSION In conclusion, testosterone determines the dysbiosis of gut microbiota, which suggests that it plays a role in the sex-related differences in colorectal carcinogenesis.
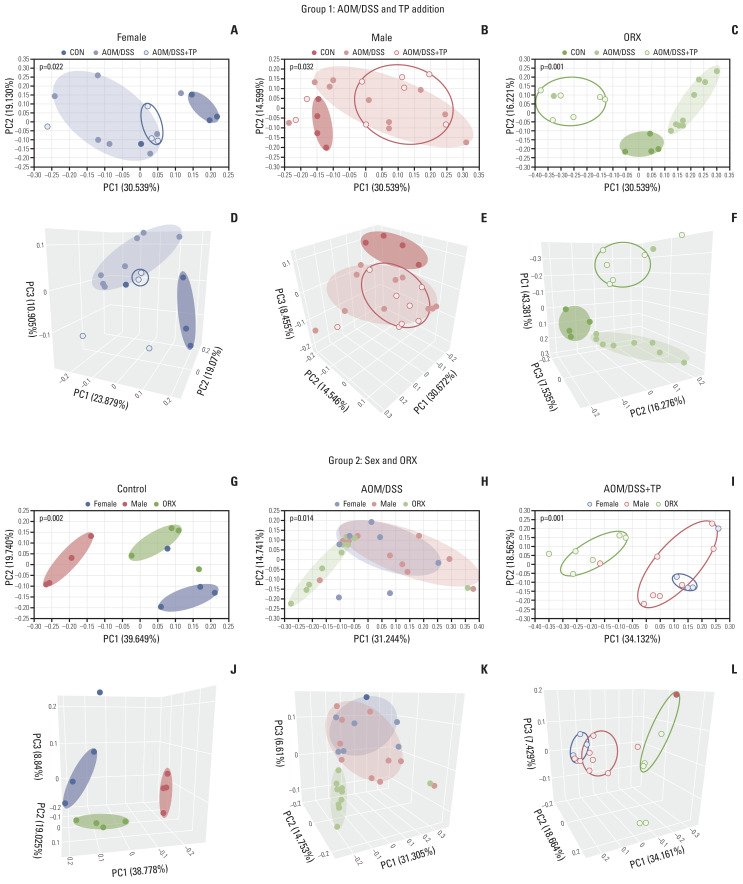
Fig. 1Study design to evaluate the effect of testosterone on gut microbiota composition during colon tumorigenesis. (A) Study design. Female, male, and orchiectomized mice were treated with AOM/DSS to induce colitis-associated CRC. One week after orchiectomy, all mice were enrolled in the AOM/DSS protocol. The mice were injected with AOM (10 mg/kg bodyweight) on day 0. One week after AOM injection, DSS (2% w/v) was provided in the drinking water for 1 week, followed by normal drinking water. TP was administered by intramuscular (i.m) injection twice a week from the day of surgery to the end of the experiment. Fecal collection and mouse sacrifice were performed at week 13 (22-weeks age) after AOM injection. (B) Data analysis scheme. In comparision group 1, the effects of AOM/DSS-induced CRC and TP addition in AOM/DSS group on the gut microbial composition was examined. In comparision group 2, the effects of male sex hormone on the gut microbial composition was examined. (C–E) Alpha diversity of gut microbiota. Next-generation sequencing was performed with 16S rRNA gene from mouse stool DNA. Observed OTU count (C), Chao1 as a species richness estimator (D), Phylogenetic Diversity as a phylogenetic richness estimator (E) of the intetinal microbiota in female, male, and ORX mice. Data are expressed as the mean±SEM. Whiskers show the minimum and maximum values. Mann-Whitney U test for comparison difference between independent two groups was performed. AOM, azoxymethane; CON, control; CRC, colorectal cancer; DSS, dextran sulfate sodium salt; ORX, orchiectomized; OTU, operational taxonomic unit; SEM, standard error of the mean; TP, testosterone propionate. *p < 0.05 for “CON vs. AOM/DSS” or “AOM/DSS vs. AOM/DSS+TP” in female, male, and ORX groups, †p < 0.05 for “Female vs. Male”, ‡p < 0.05 for “Male vs. ORX”, §p < 0.05 for “Female vs. ORX” in CON, AOM/DSS, and AOM/DSS+TP subgroups.Fig. 2Sample clustering by UniFrac-based PCoA at the species level. (A–F) Clustering to see the difference between control, AOM/DSS, and AOM/DSS+TP in female (A, D), male (B, E), ORX (C, F) group samples by PCoA 2D (A–C) and 3D (D–F) plot. (G–L) Clustering to see the difference between female, male, and ORX in control (G, J), AOM/DSS (H, K), and AOM/DSS+TP (I, L) subgroup samples by PCoA 2D (G–I) and 3D (J–L) plot. Group 1 and group 2 samples were clustered using the Generalized UniFrac method at the species level. Significance for similarity of bacterial population structure was analyzed by PERMANOVA. The clustering of each group is marked with a different color: Female control, filled red ellipse; Female AOM/DSS, filled pink ellipse; Female AOM/DSS+TP, blanked red ellipse; Male control, filled blue ellipse; Male AOM/DSS, filled skyblue ellipse; Male AOM/DSS+TP, blanked blue ellipse; ORX control, filled green ellipse; ORX AOM/DSS, filled light green ellipse; ORX AOM/DSS+TP, blanked green ellipse. AOM, azoxymethane; CON, control; DSS, dextran sulfate sodium salt; ORX, orchiectomized; PCoA, principal coordinates analysis; PERMANOMA, permutational multivariate analysis of variance; TP, testosterone propionate.Fig. 3Gut microbiota compositions at the Phylum and Family levels. (A–L) The microbiota compostion of stool conetnts from group 1 for “AOM/DSS and TP addition” criteria (A–C, G–I) and group 2 for “sex and ORX” criteria (D–F, J–L) at the Phylum (A–F) and Family (G–L) levels. Mann-Whitney U test for comparison difference between independent two groups was performed. †p < 0.05, female vs. male, ‡p < 0.05, male vs. ORX, §p < 0.05, female vs. ORX in CON, AOM/DSS, and AOM/DSS+TP mice within group 2. a)p < 0.05, CON vs. AOM/DSS, b)p < 0.05, AOM/DSS vs. AOM/DSS+TP in female, male, and ORX mice within group 1. (M–O) Firmicutes/Bacteroidetes ratio (M) calculated by dividing the abundance of Firmicutes (N) with that of Bacteroidetes (O) in female, male, and ORX mice. Data are expressed as the mean±SEM. Whiskers show the minimum and maximum values. The p-values were calculated from the Mann-Whitney U test for comparison difference between independent two groups. *p < 0.05 for “CON vs. AOM/DSS” or “AOM/DSS vs. AOM/DSS+TP” in female, male, and ORX groups, †p < 0.05 for “Female vs. Male”, ‡p < 0.05 for “Male vs. ORX”, §p < 0.05 for “Female vs. ORX” in CON, AOM/DSS, and AOM/DSS+TP subgroups. AOM, azoxymethane; CON, control; DSS, dextran sulfate sodium salt; ORX, orchiectomized; SEM, standard error of the mean; TP, testosterone propionate.Fig. 4Changes in the abundance ratio of the gut microbiome by AOM/DSS and TP addition: LEfSe analysis. (A–F) Bar plots of the LEfSe results, which were obtained based on the following criteria: (1) alpha value of the factorial Kruskal-Wallis H test between assigned taxa < 0.05; (2) the alpha value for the pairwise Wilcoxon test among the taxonomic members < 0.05; (3) threshold of the logarithmic LDA score for discriminative features < 2.0; and (4) a multi-class analysis set as all-against-all; (5) identifying and classifying the bacterial characteristics based on previous reports as “commensal bacteria,” “opportunistic pathogens,” and “not characterized”; (6) removal of non-overlapping bacteria from the “not characterized” microbiome; and (7) in the LEfSe plot, all commensal bacteria and opportunistic pathogens, and top ten “not characterized” bacteria were included. The color bars show the LDA scores of species that enriched in indicated conditions; (A) filled red bar (female control), (A, B) hatched blue bar (AOM/DSS-treated female), (B) blanked blue bar (AOM/DSS+TP-treated female), (C) filled red bar (male control), (C, D) hatched red bar (AOM/DSS-treated male), (D) blanked red bar (AOM/DSS+TP-treated male). (E) filled green bar (ORX control), (E, F) hatched green bar (AOM/DSS-treated ORX mice), (F) blanked green bar (AOM/DSS+TP-treated ORX mice). The color on the species name indicates the characteristics of each species: yellow for commensal bacteria, orange for opportunistic pathogens, and green for not characterized bacteria. Asterisks indicate the butyrate-producing bacteria. The p- and q-values were determined using the non-parametric factorial Kruskal-Wallis H test. (G) The ratio of commensal bacteria to opportunistic pathogens based on the LEfSe results in each comparison group. AOM, azoxymethane; DSS, dextran sulfate sodium salt; F, female; LDA, linear discriminant analysis; LEfSe, linear discriminant analysis effect size; M, male; NC, not calculated; ORX, orchiectomized; TP, testosterone propionate.Fig. 5Changes in the abundance ratio of the gut microbiome by sex and ORX: LEfSe analysis. (A–F) Bar plots of the LEfSe results, which were generated based on the criteria mentioned in the legend of Fig. 4. The color bars show the LDA scores of species that enriched in indicated conditions: (A) filled red bar (female control), (A, B) filled blue bar (male control), (B) filled green bar (ORX control), (C) hatched red bar (AOM/DSS-treated female), (C, D) hatched blue bar (AOM/DSS-treated male), (D) hatched green bar (AOM/DSS-treated ORX mice). (E) blanked red bar (AOM/DSS+TP-treated female), (E, F) blanked blue bar (AOM/DSS+TP-treated male), (F) blanked green bar (AOM/DSS+TP-treated ORX mice). The color on the species name indicates the characteristics of each species: yellow for commensal bacteria, orange for opportunistic pathogens, and green for not characterized bacteria. Arstericks indicate the butyrate-producing bacteria. The p- and q-values were determined using the non-parametric factorial Kruskal-Wallis H test. (G) The ratio of commensal bacteria to opportunistic pathogens based on the LEfSe results in each comparison group. AOM, azoxymethane; DSS, dextran sulfate sodium salt; F, female; LDA, linear discriminant analysis; LEfSe, linear discriminant analysis effect size; M, male; NC, not calculated; ORX, orchiectomized; TP, testosterone propionate.Fig. 6Gut microbiome showing changes in “AOM/DSS and TP addition” and “sex and ORX” criteria. (A–C) The abundance ratio of butyrate-producing bacteria among commensal bacteria. (A) Clostridium indolis (Firmicutes: Clostridia: Clostridiales: Lachnospiraceae: Clostridium_g34). (B) Flintibacter butyricus (Firmicutes: Clostridia: Clostridiales: Ruminococcaceae: Pseudoflavonifractor). (C) Kineothrix alysoides (Firmicutes: Clostridia: Clostridiales: Lachnospiraceae: Kineothrix). (D–F) The abundance ratio of commensal bacteria. (D) Parabacteroides goldsteinii (Bacteroidetes: Bacteroidia: Bacteroidales: Porphyromonadaceae: Parabacteroides). (E) Romboutsia timonensis (Firmicutes: Clostridia: Clostridiales: Peptostreptococcaceae: Romboutsia). (F) Ruminococcus bromii (Firmicutes: Clostridia: Clostridiales: Ruminococcaceae: Ruminococcus_g2). (G–J) The abundance ratio of opportunistic pathogens. (G) Bacteroides caccae (Bacteroidetes: Bacteroidia: Bacteroidales: Bacteroidaceae: Bacteroides). (H) Mucispirillum schaedleri (Deferribacteres: Deferribacteres_c: Deferribacterales: Deferribacteraceae: Mucispirillum). (I) Akkermansia muciniphila (Verrucomicrobia: Verrucomicrobiae: Verrucomicrobiales: Akkermansiaceae: Akkermansia). (J) Bacteroides vulgatus (Bacteroidetes: Bacteroidia: Bacteroidales: Bacteroidaceae: Bacteroides). AOM, azoxymethane; CON, control; DSS, dextran sulfate sodium salt; ORX, orchiectomized; SEM, standard error of the mean; TP, testosterone propionate. Data are expressed as the mean±SEM. Whiskers show the minimum and maximum values. The p-values were calculated from the Mann-Whitney U test for comparison difference between independent two groups. *p < 0.05 for “CON vs. AOM/DSS” or “AOM/DSS vs. AOM/DSS+TP” in female, male, and ORX groups, †p < 0.05 for “Female vs. Male”, ‡p < 0.05 for “Male vs. ORX”, §p < 0.05 for “Female vs. ORX” in CON, AOM/DSS, and AOM/DSS+TP subgroups.