Department of Biological Sciences, Korea Advanced Institute of Science and Technology (KAIST), Daejeon, 34141, Republic of Korea.
Department of Internal Medicine, Seoul National University College of Medicine, Seoul, 03080, Republic of Korea.
Bioinformatics Institute, Seoul National University, Seoul, 08826, Republic of Korea.
Department of Biology, Chungbuk National University, Cheongju, 28644, Republic of Korea.
Department of Computer Science and Engineering, College of Engineering, Seoul National University, Seoul, 08826, Republic of Korea.
Interdisciplinary Program in Bioinformatics, College of Natural Sciences, Seoul National University, Seoul, 08826, Republic of Korea.
Department of Internal Medicine, Seoul National University College of Medicine, Seoul, 03080, Republic of Korea. snuhgo01@gmail.com.
Genome Opinion Inc, Seoul, 04799, Republic of Korea. snuhgo01@gmail.com.
Department of Biological Sciences, Korea Advanced Institute of Science and Technology (KAIST), Daejeon, 34141, Republic of Korea. ijung@kaist.ac.kr.
Abstract
Clonal hematopoiesis of indeterminate potential (CHIP), a common aging-related process that predisposes individuals to various inflammatory responses, has been reported to be associated with COVID-19 severity. However, the immunological signature and the exact gene expression program by which the presence of CHIP exerts its clinical impact on COVID-19 remain to be elucidated. In this study, we generated a single-cell transcriptome landscape of severe COVID-19 according to the presence of CHIP using peripheral blood mononuclear cells. Patients with CHIP exhibited a potent IFN-γ response in exacerbating inflammation, particularly in classical monocytes, compared to patients without CHIP. To dissect the regulatory mechanism of CHIP (+)-specific IFN-γ response gene expression in severe COVID-19, we identified DNMT3A CHIP mutation-dependent differentially methylated regions (DMRs) and annotated their putative target genes based on long-range chromatin interactions. We revealed that CHIP mutant-driven hypo-DMRs at poised cis-regulatory elements appear to facilitate the CHIP (+)-specific IFN-γ-mediated inflammatory immune response. Our results highlight that the presence of CHIP may increase the susceptibility to hyperinflammation through the reorganization of chromatin architecture, establishing a novel subgroup of severe COVID-19 patients.
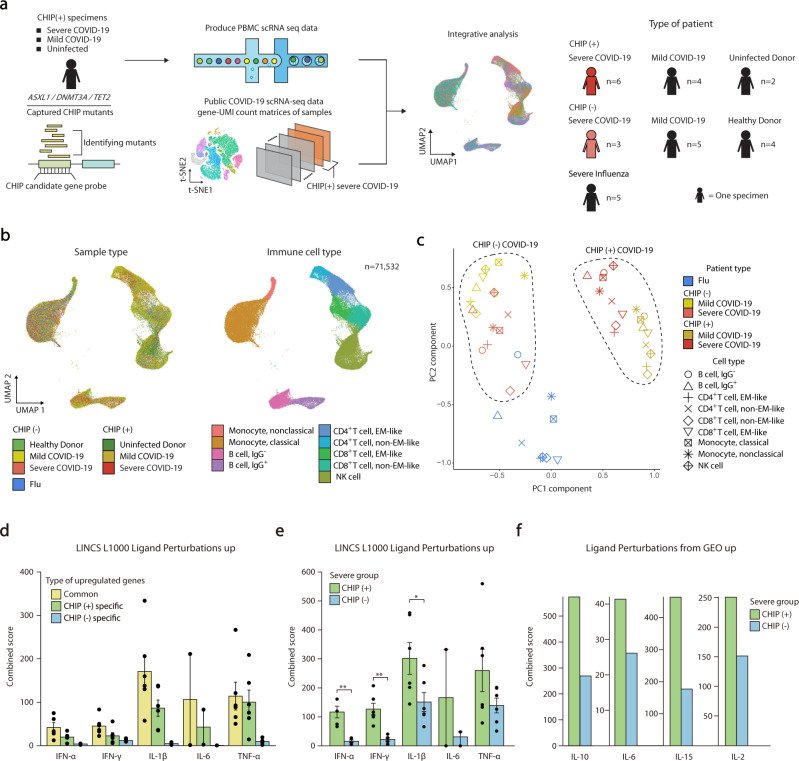
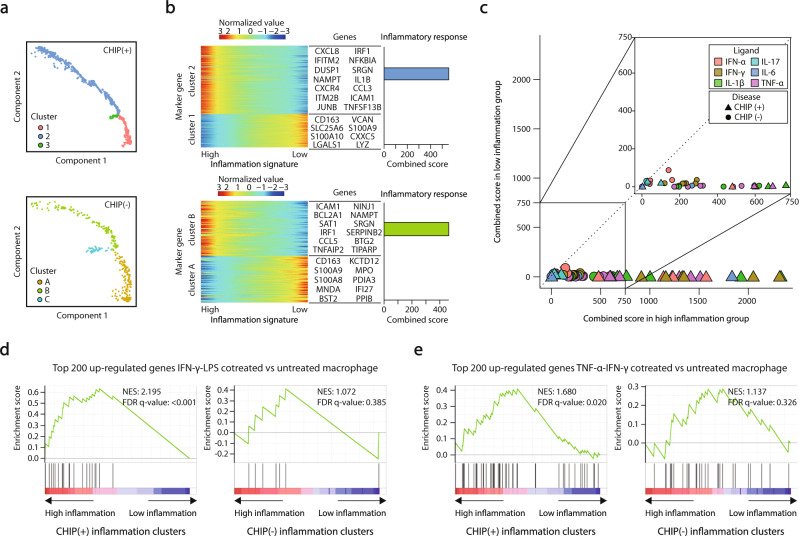
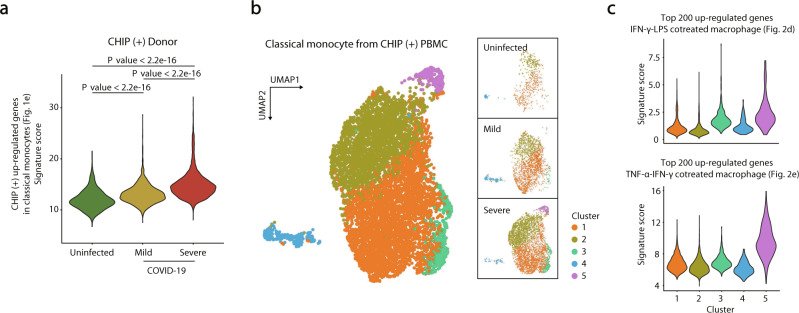
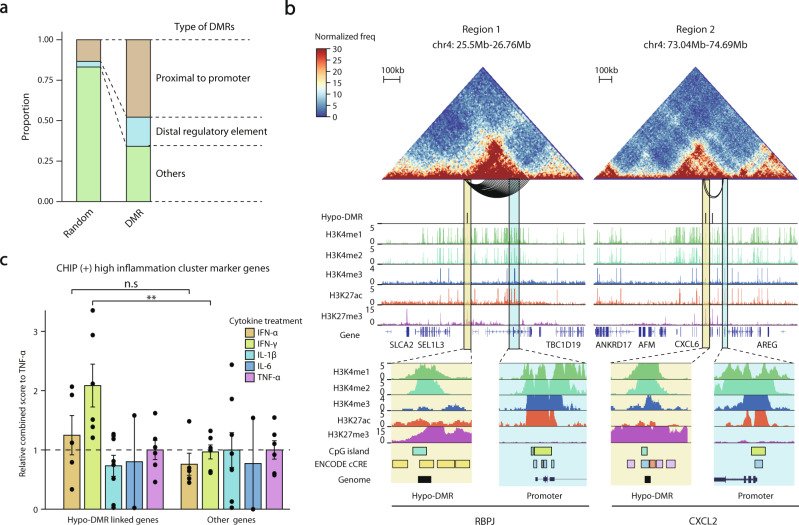
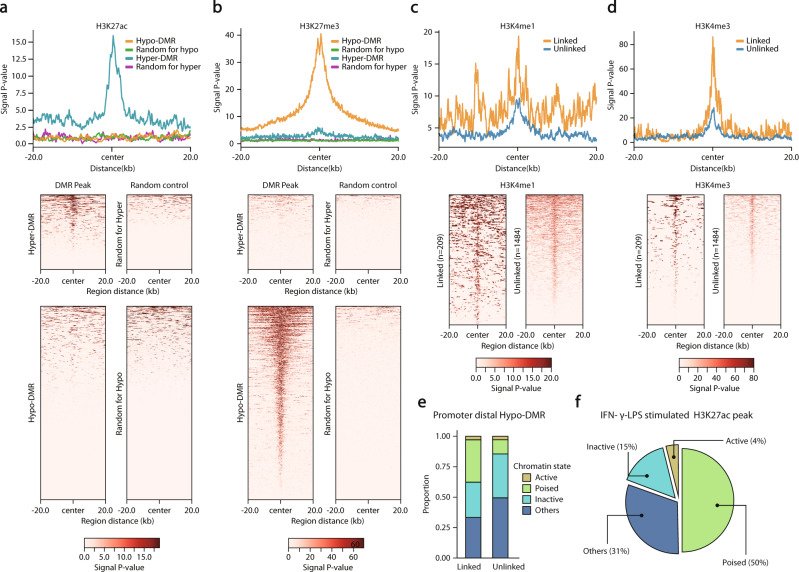
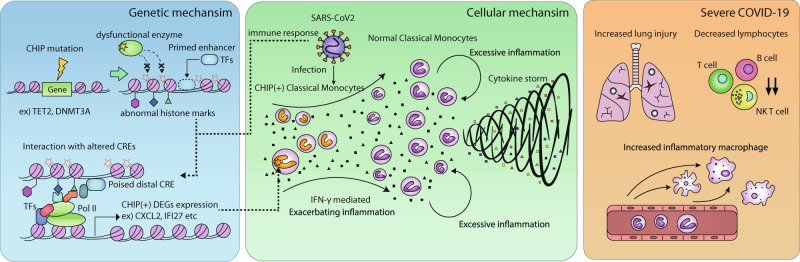
Fig. 1 Single-cell transcriptome analyses of COVID-19 according to CHIP status. a Overview of the study design. b Scatter plots of integrated scRNA-seq data represented by the UMAP method. Left, colored by group information. Right, annotated on immune cells. c PCA of transcriptome profiles according to immune cell types and disease groups. d Bar plots showing combined scores of the LINCS L1000 Ligand Perturbations up gene ontology library for upregulated genes of severe CHIP (+) and CHIP (-) compared to CHIP (-) mild COVID-19. Each point indicates one ligand perturbation term in the library: IFN-α (n = 5), IL-1β (n = 6), IFN-γ (n = 6), IL-17 (n = 2), IL-6 (n = 2) and TNF-α (n = 6). The mean and standard error of the mean (SEM) of each gene set are shown. e Bar plots showing combined scores of DEGs in classical monocytes between CHIP (+) and CHIP (-) severe COVID-19 for the same gene ontology library in (d). The mean and standard error of the mean (SEM) of each gene set are shown. A one-sided Mann‒Whitney’s U test was performed (*P < 0.05, **P < 0.01). f Bar plots showing combined scores of the same gene sets in (e) for Ligand Perturbations from GEO up gene ontology library.Fig. 2 Pseudotime analyses of severe COVID-19 with CHIP in classical monocytes. a–c Pseudotime analyses for CHIP (+) or CHIP (-) severe COVID-19 patients. a Cells were aligned according to the pseudotime axis calculated using Monocle2. The color indicates the type of cluster. Top, CHIP (+) patients. Bottom, CHIP (-) patients. b Heatmaps representing the expression levels of marker genes for the ordered cells. The list of genes is the representative gene set for each cluster. Bar plots showing the combined scores of each cluster for the inflammatory response term in MsigDB Hallmark 2020. c Scatter plots of the combined scores of marker genes of inflammation clusters for the LINCS L1000 Ligand Perturbations up gene ontology library. Horizontal axis, high inflammation cluster; vertical axis, low inflammation cluster. The identity lines are presented diagonally. The shapes represent the type of patients. Colors indicate the types of perturbed ligands for IFN-α (n = 5), IL-1β (n = 6), IFN-γ (n = 6), IL-17 (n = 2), IL-6 (n = 2) and TNF-α (n = 6). d, e GSEA plots for marker genes of inflammation clusters in CHIP (+) and CHIP (-) individuals, respectively. Genes are ordered based on log-fold changes between high- and low-inflammation clusters. Normalized enrichment scores (NES) and FDR are presented for (d) DEGs between IFN-γ-LPS vs. untreated human macrophages41 and (e) DEGs between TNF-α-IFN-γ cotreatment and untreated conditions39.Fig. 3 Validation of the IFN-γ signature according to COVID-19 severity in CHIP (+) individuals. a Violin plots presenting distributions of signature scores in individual cells for CHIP (+) upregulated genes in classical monocytes (Fig. 1e). CHIP (+) uninfected donors, n = 482; CHIP (+) mild COVID-19, n = 2163; CHIP (+) severe COVID-19, n = 4408. A two-sided Kolmogorov‒Smirnov test was performed. b UMAP showing subclusters in classical monocytes from all CHIP (+) individuals (left), uninfected donors (top right), mild COVID-19 (middle right), and severe COVID-19 (bottom right). c Violin plots showing the distributions of scores for DEGs between IFN-γ-LPS and untreated human macrophages (top) and DEGs between TNF-α-IFN-γ cotreated and untreated conditions (bottom) in each cell from each cluster. Cluster 1, n = 3543; Cluster 2, n = 2636; Cluster 3, n = 385; Cluster 4, n = 272; Cluster 5, n = 217.Fig. 4 Regulatory potential of DNMT3A CHIP-specific hypo-DMRs in IFN-γ response genes. a Stacked bar plots showing the proportion of annotated hypo- and hyper-DMRs. In DMRs: proximal to the promoter, n = 1124; distal regulatory element, n = 423; others, n = 801. In randomly selected DMRs: proximal to the promoter, n = 314; distal regulatory element, n = 81; others, n = 1953. b Hi-C heatmap and other regulatory features for two example regions. Top, Hi-C contact maps (heatmap) for region 1 (RBPJ) and region 2 (CXCL2) with significant long-range chromatin interactions with the promoter regions and hypo-DMRs (arcs below the heatmap). Middle, distribution of hypo-DMRs and histone modification signals along Hi-C contact maps. Bottom, snapshots of interacting regions in the UCSC genome browser58. Each DMR and promoter region are highlighted in yellow and blue, respectively. On the CpG island track, the color indicates the length of the islands: light green, smaller than 300 bases; cyan, larger than 300 bases. On the ENCODE cCRE track, the color indicates the type of signature of the DNA element: yellow, distal enhancer-like signature; orange, proximal enhancer-like signature; blue, promoter-like signature; purple, Dnase-H3K4me3 signature. For promoter regions, neither distal nor proximal enhancer signatures are shown in the figure. c Bar plots of combined scores relative to TNF-α for hypo-DMR linked genes and others for the same gene ontology library in Fig. 2c. Each point indicates a single-ligand perturbation term. The mean and standard error of the mean (SEM) of each gene set are presented in a bar plot. A one-sided Mann‒Whitney’s U test was performed (n.s.: nonsignificant, **P < 0.01).Fig. 5 Chromatin states of hypo-DMRs linked to CHIP specifically upregulated genes. a, b ChIP-seq signal distribution (a) for H3K27ac and (b) for H3K27me3 of 20k upstream and downstream surrounding hypo-DMRs (n = 1693), hyper-DMRs (n = 655), and randomly selected regions. Each randomly selected region has the same distribution of chromosome number and length of hypo- and hyper-DMRs, respectively. Top, average ChIP-seq signal distributions. Bottom, heatmaps of ChIP-seq signals of the corresponding regions. c, d ChIP-seq signal distribution for CHIP (+) upregulated genes linked (n = 209) and unlinked (n = 1484) hypo-DMRs for H3K4me1 and H3K4me3. Top, average profiles of ChIP-seq signals for linked and unlinked hypo-DMRs. Bottom, heatmaps of ChIP-seq signals of the corresponding regions. e Stacked bar plots of the linked and unlinked hypo-DMRs with the annotation of chromatin states. The plots show annotations of hypo-DMRs distal to promoters. f A pie chart showing the proportions of chromatin states of promoter distal hypo-DMRs intersected with H3K27ac ChIP-seq peaks in IFN-γ/LPS-stimulated human macrophages. For statistical significance, a one-sided Fisher’s exact test was performed to compare each annotated hypo-DMRs and the remaining promoter-distal hypo-DMRs for the enrichment of H3K27ac peaks.Fig. 6 A proposed model for the pathogenesis of severe COVID-19 in patients with CHIP. A schematic overview showing the progression of disease exacerbation in terms of gene regulation, cellular levels, and clinical/immunological signatures in CHIP (+) severe COVID-19.
그림 출처: PubMed Central 공개 논문 (PMC9559247)
Conflict of interest statement
Y.Koh. is the CEO of Genome Opinion. The other authors declare no competing interests.
그 밖의 정보
출판 형태
Journal Article, Research Support, Non-U.S. Gov't
저널
Experimental & molecular medicine · eISSN 2092-6413