Department of Biomedical Sciences, Seoul National University College of Medicine, Seoul, Korea.
Department of Internal Medicine, Seoul National University College of Medicine, Seoul, Korea.
Genomic Medicine Institute, Seoul National University Medical Research Center, Seoul, Korea.
Department of Molecular Medicine and Biopharmaceutical Sciences, Graduate School of Convergence Science and Technology, College of Medicine, Seoul National University, Seoul, Korea.
Biomedical Research Institute, Seoul National University Hospital, Seoul, Korea. suschung@snu.ac.kr.
Department of Internal Medicine, Seoul National University College of Medicine, Seoul, Korea. kspark@snu.ac.kr.
Department of Molecular Medicine and Biopharmaceutical Sciences, Graduate School of Convergence Science and Technology, College of Medicine, Seoul National University, Seoul, Korea. kspark@snu.ac.kr.
Abstract
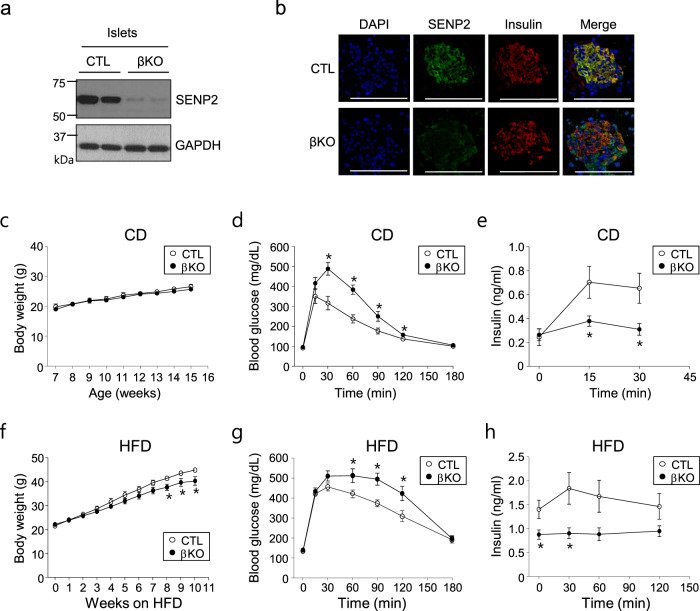
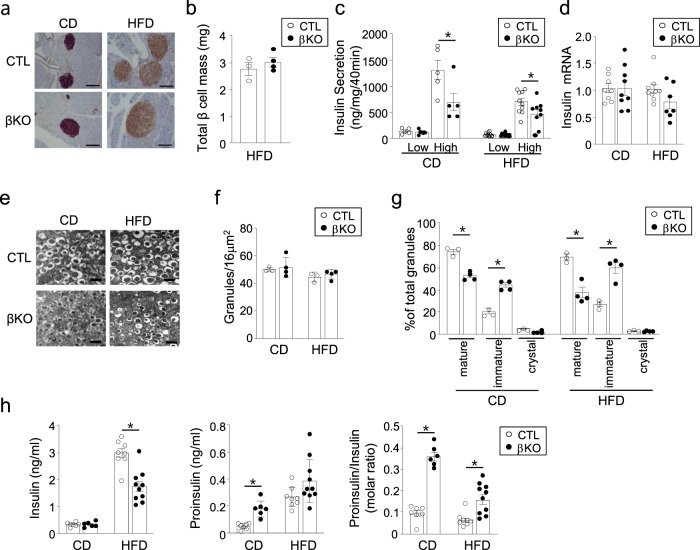
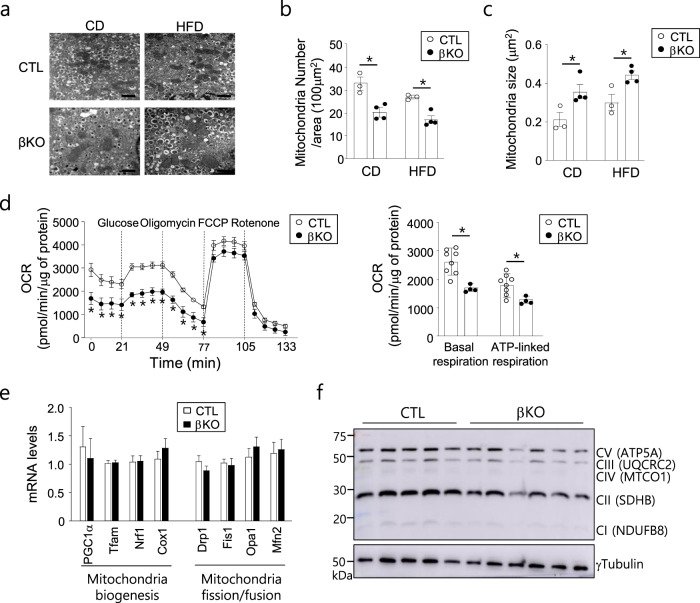
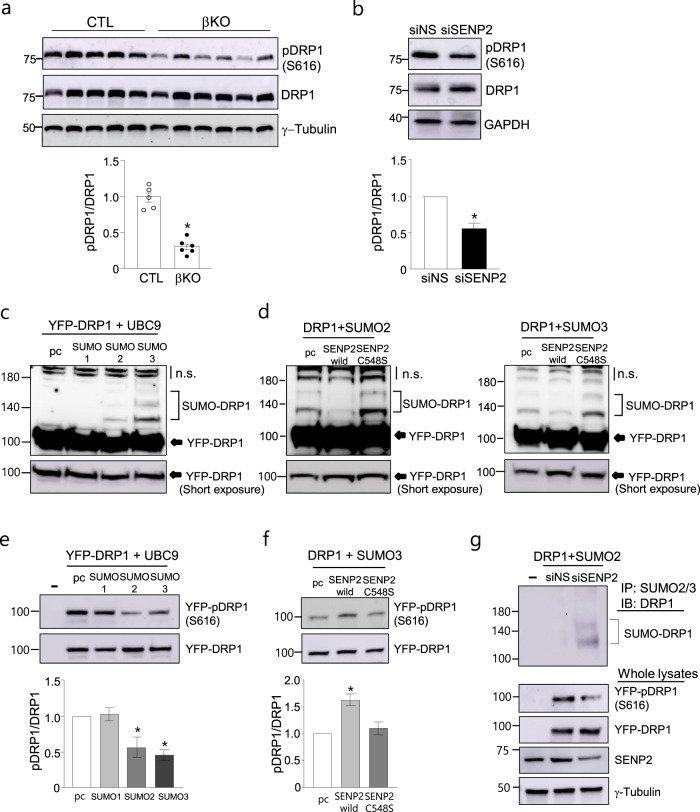
Increasing evidence has shown that small ubiquitin-like modifier (SUMO) modification plays an important role in metabolic regulation. We previously demonstrated that SUMO-specific protease 2 (SENP2) is involved in lipid metabolism in skeletal muscle and adipogenesis. In this study, we investigated the function of SENP2 in pancreatic β cells by generating a β cell-specific knockout (Senp2-βKO) mouse model. Glucose tolerance and insulin secretion were significantly impaired in the Senp2-βKO mice. In addition, glucose-stimulated insulin secretion (GSIS) was decreased in the islets of the Senp2-βKO mice without a significant change in insulin synthesis. Furthermore, islets of the Senp2-βKO mice exhibited enlarged mitochondria and lower oxygen consumption rates, accompanied by lower levels of S616 phosphorylated DRP1 (an active form of DRP1), a mitochondrial fission protein. Using a cell culture system of NIT-1, an islet β cell line, we found that increased SUMO2/3 conjugation to DRP1 due to SENP2 deficiency suppresses the phosphorylation of DRP1, which possibly induces mitochondrial dysfunction. In addition, SENP2 overexpression restored GSIS impairment induced by DRP1 knockdown and increased DRP1 phosphorylation. Furthermore, palmitate treatment decreased phosphorylated DRP1 and GSIS in β cells, which was rescued by SENP2 overexpression. These results suggest that SENP2 regulates mitochondrial function and insulin secretion at least in part by modulating the phosphorylation of DRP1 in pancreatic β cells.
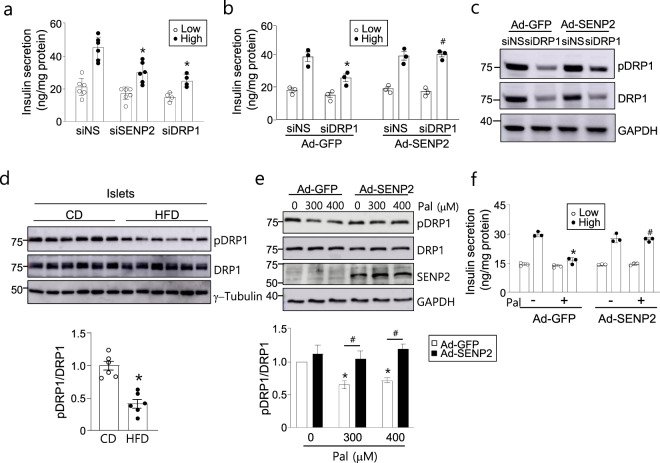
Fig. 1 Glucose tolerance and insulin secretion in the Senp2-βKO mice. a Pancreatic islets were isolated from the control (CTL) or Senp2-βKO (βKO) mice, and then, SENP2 expression was detected by western blot analysis. b Pancreatic islets were subjected to immunofluorescence staining using antibodies against SENP2 and insulin; scale bar: 100 μm. c–e The control and Senp2-βKO mice were fed a control chow diet (CD). c Body weights. Serum glucose (d) and insulin levels (e) were measured at the indicated time points after glucose infusion (2 g/kg body weight). Data are presented as the mean ± SEM, n = 7 (CTL), 9 (βKO) (body weight), 5 (CTL), 6 (βKO) (GTT), and 6 (CTL), 7 (βKO) (insulin levels). *P < 0.05, t-test. f–h The control and Senp2-βKO mice were fed a high-fat diet (HFD). f Body weights. Serum glucose (g) and insulin levels (h) after glucose infusion (1 g/kg body weight). Data are presented as the mean ± SEM, n = 9 (CTL), 7 (βKO) (body weight, GTT), and 6 (serum insulin). *P < 0.05, t-test. All data are presented as the mean ± SEM.Fig. 2 Pancreatic β cell-specific Senp2 knockout affects insulin processing and maturation. a Immunohistochemical staining of the pancreas with insulin antibodies, scale bar: 100 μm. b Total β cell mass of the control and Senp2-βKO mice fed a 16-week HFD was measured with the following equation: β cell mass = pancreas weight × β cell area/pancreas area, which was determined by immunohistochemical staining with an insulin antibody. n = 3–4 mice. c GSIS of isolated islets from the control or Senp2-βKO mice. Islets were incubated under 2.8 mM (low) or 17.8 mM (high) glucose concentrations. n = 5–10 per group. *P < 0.05, t-test. d Relative insulin mRNA levels of the islets from the control and Senp2-βKO mice. The mRNA level of the control group was set to 1, and other values are expressed relative to this level. n = 7–9 per group. e Representative EM images (40000x) of isolated islets of the control and Senp2-βKO mice; scale bar: 500 nm. f, g Manual quantification and classification of insulin granules were performed on 5–6 areas/islet, >100 isolated islets/mouse. Total insulin granules per unit area (f) and distribution of insulin granule types (g), n = 3–4 mice per group, *P < 0.05, t-test. h Fasting serum insulin and proinsulin concentrations of the control and Senp2-βKO mice were measured after CD (20 weeks old) or 16 weeks of HFD (24 weeks old) feeding. Insulin (the left panel), proinsulin (the middle panel), and molar ratio of proinsulin to insulin (the right panel), n = 6–10 per group. *P < 0.05, t-test. All data are presented as the mean ± SEM.Fig. 3 Effects of Senp2 knockout on mitochondrial morphology and function of β cells. a EM images (x20000) of the isolated islets, scale bar: 1 μm, numbers of mitochondria per unit area (b), and average size of mitochondria (c). n = 3–4 mice per group, >70 mitochondria/mouse, *P < 0.05, t-test. d Oxygen consumption rates of the islets from the mice fed a CD. n = 8 (CTL), 4 (βKO), *P < 0.05, t-test. e Relative mRNA levels of the indicated genes in the islets of the control and Senp2-βKO mice on a CD. The mRNA level of the control group was set to 1, and the other values are expressed relative to this level. n = 8–15, t-test. f Western blot analysis was performed with islets isolated from the control and Senp2-βKO mice using antibodies against the indicated OXPHOS proteins. All data are presented as the mean ± SEM.Fig. 4 SUMO2/3 modification inhibits the phosphorylation of DRP1 in pancreatic β cells. a Western blot analysis was performed with islets isolated from the control or Senp2-βKO mice. Antibodies against pDRP1 (S616) and DRP1 (total DRP1) were used (the upper panel). The band densities were measured, and the ratio of pDRP1 to DRP1 of the control set was set to 1 (the lower panel). n = 5 (CTL) and 6 (βKO). *P < 0.05 vs. the control, t-test. b NIT-1 cells were transfected with siRNAs against SENP2 (siSENP2) or nonspecific control siRNAs (siNS). Cell lysates were used for western blot analysis (the upper panel). The ratio of pDRP1 to total DRP1 was measured (the lower panel). n = 4, *P < 0.05 vs. siNS, t-test. c, d NIT-1 cells were transfected with the expression vectors, and then, western blot analysis was performed using a DRP1 antibody 48 h after transfection. Cells were transfected with expression vectors for YFP-DRP1, UBC9, and SUMO1, −2 or −3 as indicated (c). Expression vectors for SENP2 (wild type) or SENP2 C548S (an inactive form) were transfected (d). pcDNAs (pc) were transfected as a control; nonspecific bands (n.s.). e, f After transfection of the indicated vectors, western blotting was performed with antibodies against pDRP1 (S616) and DRP1 (the upper panel), and then, the ratio of pDRP1 to total DRP1 was measured (the lower panel). The ratio in the absence of SUMO was set to 1, and the other values are expressed relative to this level (e). n = 4, *P < 0.05 vs. without SUMO, t-test. The ratio in the absence of SENP2 was set to 1, and the other values are expressed relative to this level (f). n = 4, *P < 0.05 vs. without SENP2, t-test. g NIT-1 cells were treated with siSENP2 and then transfected with YFP-DRP1 and SUMO2 expression vectors. Cell lysates were subjected to immunoprecipitation using a SUMO2/3 antibody 36 h after transfection. All data are presented as the mean ± SEM.Fig. 5 SENP2 overexpression restores DRP1 phosphorylation and insulin secretion. a GSIS was assessed 72 h after siRNA transfection in NIT-1 cells. n = 3–5. *P < 0.05 vs. siNS/high glucose, t-test. b, c NIT-1 cells were transfected with siDRP1, and after 4 h, the cells were infected with Ad-SENP2. GSIS was measured 2 days after virus infection. b Cells were incubated under low or high glucose concentrations. n = 3, *P < 0.05 vs. siNS/Ad-GFP (high), #P < 0.05 vs. siDRP1/Ad-GFP (high), t-test. c Cell lysates were used for western blot analysis. d Islets were isolated from mice fed a CD or HFD for 20 weeks, and then, western blotting was performed. n = 6, *P < 0.05 vs. CD, t-test. e NIT-1 cells were infected with Ad-GFP or Ad-SENP2 for 24 h and then treated with palmitate for another 24 h. Western blotting was performed, and the ratio of pDRP1/DRP was measured. The pDRP1/DRP1 value of the Ad-GFP-infected cells in the absence of palmitate was set to 1. n = 3, *P < 0.05 vs. Pal (0 μM)/Ad-GFP, #P < 0.05, t-test. f NIT-1 cells were infected with Ad-GFP or Ad-SENP2 for 24 h followed by palmitate (300 μM) treatment for 24 h, and then, GSIS was assessed. n = 3. *P < 0.05 vs. Pal (−)/Ad-GFP (high), #P < 0.05 vs. Pal (+)/Ad-GFP (high), t-test. All data are presented as the mean ± SEM.
그림 출처: PubMed Central 공개 논문 (PMC8814193)
Conflict of interest statement
The authors declare no competing interests.
그 밖의 정보
출판 형태
Journal Article, Research Support, Non-U.S. Gov't
저널
Experimental & molecular medicine · eISSN 2092-6413